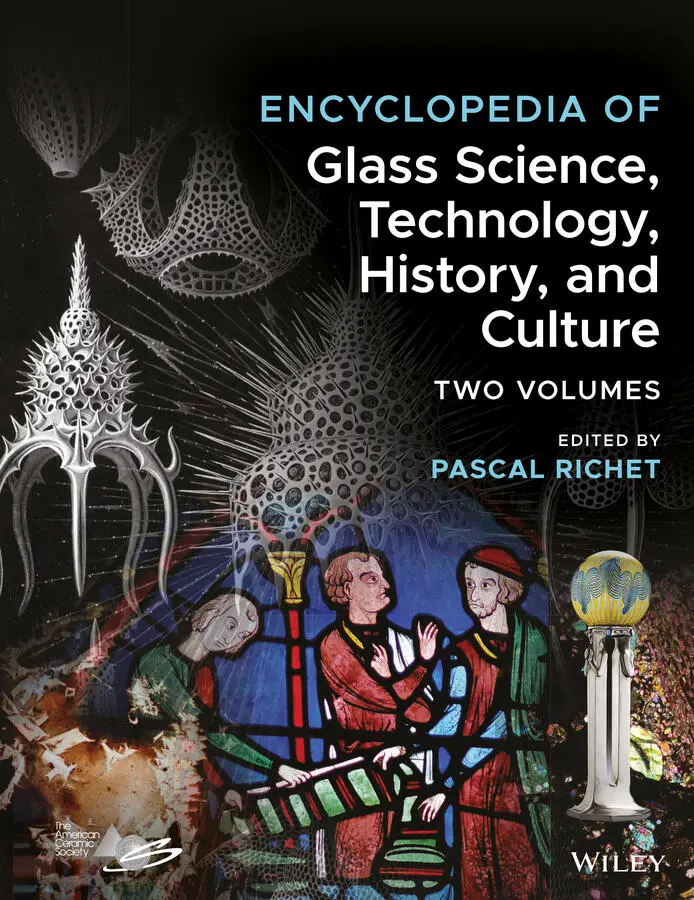
Encyclopedia of Glass Science, Technology, History, and Culture
Здесь есть возможность читать онлайн «Encyclopedia of Glass Science, Technology, History, and Culture» — ознакомительный отрывок электронной книги совершенно бесплатно, а после прочтения отрывка купить полную версию. В некоторых случаях можно слушать аудио, скачать через торрент в формате fb2 и присутствует краткое содержание. Жанр: unrecognised, на английском языке. Описание произведения, (предисловие) а так же отзывы посетителей доступны на портале библиотеки ЛибКат.
- Название:Encyclopedia of Glass Science, Technology, History, and Culture
- Автор:
- Жанр:
- Год:неизвестен
- ISBN:нет данных
- Рейтинг книги:3 / 5. Голосов: 1
-
Избранное:Добавить в избранное
- Отзывы:
-
Ваша оценка:
Encyclopedia of Glass Science, Technology, History, and Culture: краткое содержание, описание и аннотация
Предлагаем к чтению аннотацию, описание, краткое содержание или предисловие (зависит от того, что написал сам автор книги «Encyclopedia of Glass Science, Technology, History, and Culture»). Если вы не нашли необходимую информацию о книге — напишите в комментариях, мы постараемся отыскать её.
The
has been designed to satisfy the needs and curiosity of a broad audience interested in the most varied aspects of material that is as old as the universe. As described in over 100 chapters and illustrated with 1100 figures, the practical importance of glass has increased over the ages since it was first man-made four millennia ago. The old-age glass vessels and window and stained glass now coexist with new high-tech products that include for example optical fibers, thin films, metallic, bioactive and hybrid organic-inorganic glasses, amorphous ices or all-solid-state batteries.
In the form of scholarly introductions, the Encyclopedia chapters have been written by 151 noted experts working in 23 countries. They present at a consistent level and in a self-consistent manner these industrial, technological, scientific, historical and cultural aspects. Addressing the most recent fundamental advances in glass science and technology, as well as rapidly developing topics such as extra-terrestrial or biogenic glasses, this important guide:
Begins with industrial glassmaking Turns to glass structure and to physical, transport and chemical properties Deals with interactions with light, inorganic glass families and organically related glasses Considers a variety of environmental and energy issues And concludes with a long section on the history of glass as a material from Prehistory to modern glass science The
has been written not only for glass scientists and engineers in academia and industry, but also for material scientists as well as for art and industry historians. It represents a must-have, comprehensive guide to the myriad aspects this truly outstanding state of matter.
Encyclopedia of Glass Science, Technology, History, and Culture — читать онлайн ознакомительный отрывок
Ниже представлен текст книги, разбитый по страницам. Система сохранения места последней прочитанной страницы, позволяет с удобством читать онлайн бесплатно книгу «Encyclopedia of Glass Science, Technology, History, and Culture», без необходимости каждый раз заново искать на чём Вы остановились. Поставьте закладку, и сможете в любой момент перейти на страницу, на которой закончили чтение.
Интервал:
Закладка:
45 Chapter 5.3Figure 1 Gibbs free energy of formation from the elements at the standard st...Figure 2 Room‐pressure liquidus of the CaO–SiO 2system derived from the hybr...Figure 3 Ghiorso–Carmichael model [7]. Partial derivative of Gibbs free ener...Figure 4 Component activities in CaO–SiO 2melts at 1823 K and 1 bar: predict...Figure 5 Integral mixing properties for different values of the interaction ...Figure 6 Solid–liquid equilibria calculated for the CaO–Al 2O 3–SiO 2system wi...Figure 7 Solid–liquid equilibria calculated for the CaO–Al 2O 3–SiO 2system wi...Figure 8 The σ ‐bonding orbitals of the [Si 4(OH 2) 4] ring resolved at the...
46 Chapter 5.4Figure 1 The classical model of nucleation and possible generalizations. (a)...Figure 2 Experimental nucleation rate data for several silicate glasses. (a)...Figure 3 Crystal growth rates for Li 2O∙2SiO 2glasses obtained by different a...Figure 4 Crystal morphologies formed by nucleation and growth in glass‐formi...Figure 5 Simulated TTT curves for a BaO∙2TiO 2∙2SiO 2glass with crystallized ...
47 Chapter 5.5Figure 1 With water as an example, schematic representations of phase relati...Figure 2 Isothermal solubility of pure water in various silicate melts as a ...Figure 3 Speciation of water as molecular H 2O and OH groups in melts of comp...Figure 4 Solubility of carbon dioxide in CaO–MgO–Al 2O 3–SiO 2melts determined...Figure 5 Calculated proportion of molecular CO 2and carbonate groups, CO 3, i...Figure 6 Solubility of CO 2and CO in melts in equilibrium with either pure C...Figure 7 Solubility of oxidized and reduced carbon as a function of Na/Si ra...Figure 8 Solubility of nitrogen in quenched Na 2Si 4O 9melt as a function of p...Figure 9 Sulfur solubility in Na 2O–SiO 2melts as a function of redox conditi...Figure 10 Solubility of nonreactive gases in tholeiite basalt melts at ambie...
48 Chapter 5.6Figure 1 Ellingham diagram as modified by Richardson and Jeffes [4]: Δ r G ° (...Figure 2 Ellingham diagram (after [6]) for several oxides in the float‐glass...Figure 3 Kinetic modes for the oxidation of a Fe 2+‐rich aluminosilicate glas...Figure 4 Schematic illustration of small polaron dynamics in silicate glassm...Figure 5 Open‐system redox dynamics in the NCS‐on‐Sn float‐glass process [6]...Figure 6 Thermodynamic analysis associated with open‐system reduction and cl...
49 Chapter 5.7Figure 1 Optical absorption spectrum (in the UV region) of Pb 2+probe ion di...Figure 2 Plot of oxide(‐II) polarizability, α oxide(‐II), versus o...Figure 3 Plot of oxide(‐II) electronegativity, x O, in binary oxides M aO b, ag...Figure 4 Schematic bonding chart for binary oxides (abbreviated for clarity)...
50 Chapter 5.8Figure 1 Three kinds of glass electrode design for pH and pM measurements. (...Figure 2 Extent of linearity of the E –pH relationship of a 22 mol % Na 2O sil...Figure 3 Structural role of elements as determined from electrode properties...Figure 4 Typical profiles of ion concentrations in the surface layers of gla...
51 Chapter 5.9Figure 1 Experimental set up for measurements of oxygen activities in a glas...Figure 2 Experimental set up for voltammetric measurements in glass melts.Figure 3 Effects of temperature on peak potentials in voltammograms recorded...Figure 4 Effects of (MgO, SiO 2) substitution on peak potentials in voltammog...Figure 5 Voltammetric peak potentials as a function of the MgO concentration...Figure 6 Voltammetric peak potentials of the Cu +/Cu 2+peak as a function of ...Figure 7 Effect of temperature on the electrochemical series for a glass wit...Figure 8 Arrhenius plot of the diffusion coefficients of various polyvalent ...Figure 9 Arrhenius plot for the mean diffusion coefficients of Cu +/Cu 2+for ...Figure 10 Voltammogram recorded for a green glass melt (curve 1) and a melt ...Figure 11 Impedance spectra in a melt with the basic composition 16 Na 2O·15 ...Figure 12 Equivalent circuit used to simulate the obtained impedance spectra...Figure 13 Dependence of the Warburg parameter on the superimposed d.c. poten...
52 Chapter 5.10Figure 1 Scheme of a liquid sessile drop in equilibrium with a solid substra...Figure 2 Successive temperature–time steps of the “transferred drop” variant...Figure 3 Scale of formal potential ( E f) at 1050 °C of the main redox couples...Figure 4 Chromium solubility (at %) and residual sulfur content (wt %) in a ...Figure 5 Pathway for the formation of layers at the metal/molten glass inter...Figure 6 Sketch of a working electrode for corrosion characterization of met...Figure 7 Effects of tellurium reduction on platinum stability in argon atmos...Figure 8 Passivation plateau of chromium seen in anode polarization measurem...Figure 9 Anodic polarization curves of Co‐based alloy in borosilicate glass ...
53 Chapter 5.11Figure 1 Cation exchange described by reaction (1) at the surface of a soda‐...Figure 2 Diffusion‐controlled nature of the alteration reaction (1) demonstr...Figure 3 The very strong sensitivity to pH of the solubility of silica glass...Figure 4 Effect of solution renewal on the dissolution kinetics of a soda‐li...Figure 5 Average number of layers of molecular water on the surface of vario...Figure 6 Effect of rinsing on the inner surface of a soda–lime bottle after ...Figure 7 Optical micrography of large CaCO 3crystal present on the inner sid...
54 Chapter 5.12Figure 1 Cross‐sectional diagrams of early models of an altered glass layer....Figure 2 The distinct chemistry and structure of the three layers of the lea...Figure 3 The interdiffusion zone, gel, and surficial crystalline phases of t...Figure 4 Chemical profiles of pristine glass–hydrated glass interface obtain...Figure 5 Hybrid leached‐layer preferential dissolution model [6] illustrated...Figure 6 Glass corrosion by CIDR. (a) Initial stage: congruent glass dissolu...Figure 7 Corrosion of SON68 borosilicate glass altered at 50 °C in water for...Figure 8 Chemical evolution of SON68 borosilicate glass after one month of c...Figure 9 Complex chemical patterns and prevalent μm‐sized porosity of silica...Figure 10 Aqueous elemental release curves as a function of time measured du...
55 Section VIFigure 1 Coloration in a thirteenth‐century stained glass of Chartres cathed...
56 Chapter 6.1Figure 1 Reflection and refraction of a light hitting a glass surface from t...Figure 2 Light reflected by a glass surface.Figure 3 Light passing through interfaces where the index of refraction is c...Figure 4 Index of refraction of SiO 2glass (Corning code 7940) from the ultr...Figure 5 Abbe diagram for inorganic glasses and organic polymers. WG, soda‐l...Figure 6 External refraction and total internal reflection in glass. (a) Ref...Figure 7 Relationship between absorption peak and refractive index.Figure 8 Absorption spectrum of window glass.Figure 9 Effect of composition on room‐temperature refractive indices at 589...Figure 10 Refraction of a light beam coming from the left and traveling para...
57 Chapter 6.2Figure 1 French stained glass from the thirteenth century (cf. Figure VI). (...Figure 2 Glass coloration as examined from the standpoints of absorption and...Figure 3 Successive splittings of d‐orbitals of transition elements in diffe...Figure 4 Influence of the electronic configuration on the optical absorption...Figure 5 Optical spectra and structural models explaining the color of purpl...Figure 6 Effect of nickel coordination on the absorbance spectra (derived fr...Figure 7 Molar extinction coefficients of Cr 3+in K‐, Na‐, and Li‐trisilicat...Figure 8 Influence of the nature of the alkali cation on the intensity but n...Figure 9 Variation of Cr 3+crystal‐field splitting, represented as the cryst...Figure 10 Linear absorbance spectra of Cr 3+and (CrO 4) 2−in soda‐lime‐...Figure 11 Green Cr‐containing glasses turning yellow at ca. 500 °C, a direct...Figure 12 Modification of the optical absorption spectrum of Cr 3+in a potas...Figure 13 Coloration arising from charge transfer processes. (a) Dark color ...Figure 14 Transmittance curves for the crown glass used for Photogray Extra®...
Читать дальшеИнтервал:
Закладка:
Похожие книги на «Encyclopedia of Glass Science, Technology, History, and Culture»
Представляем Вашему вниманию похожие книги на «Encyclopedia of Glass Science, Technology, History, and Culture» списком для выбора. Мы отобрали схожую по названию и смыслу литературу в надежде предоставить читателям больше вариантов отыскать новые, интересные, ещё непрочитанные произведения.


Обсуждение, отзывы о книге «Encyclopedia of Glass Science, Technology, History, and Culture» и просто собственные мнения читателей. Оставьте ваши комментарии, напишите, что Вы думаете о произведении, его смысле или главных героях. Укажите что конкретно понравилось, а что нет, и почему Вы так считаете.