Encyclopedia of Glass Science, Technology, History, and Culture
Здесь есть возможность читать онлайн «Encyclopedia of Glass Science, Technology, History, and Culture» — ознакомительный отрывок электронной книги совершенно бесплатно, а после прочтения отрывка купить полную версию. В некоторых случаях можно слушать аудио, скачать через торрент в формате fb2 и присутствует краткое содержание. Жанр: unrecognised, на английском языке. Описание произведения, (предисловие) а так же отзывы посетителей доступны на портале библиотеки ЛибКат.
- Название:Encyclopedia of Glass Science, Technology, History, and Culture
- Автор:
- Жанр:
- Год:неизвестен
- ISBN:нет данных
- Рейтинг книги:3 / 5. Голосов: 1
-
Избранное:Добавить в избранное
- Отзывы:
-
Ваша оценка:
Encyclopedia of Glass Science, Technology, History, and Culture: краткое содержание, описание и аннотация
Предлагаем к чтению аннотацию, описание, краткое содержание или предисловие (зависит от того, что написал сам автор книги «Encyclopedia of Glass Science, Technology, History, and Culture»). Если вы не нашли необходимую информацию о книге — напишите в комментариях, мы постараемся отыскать её.
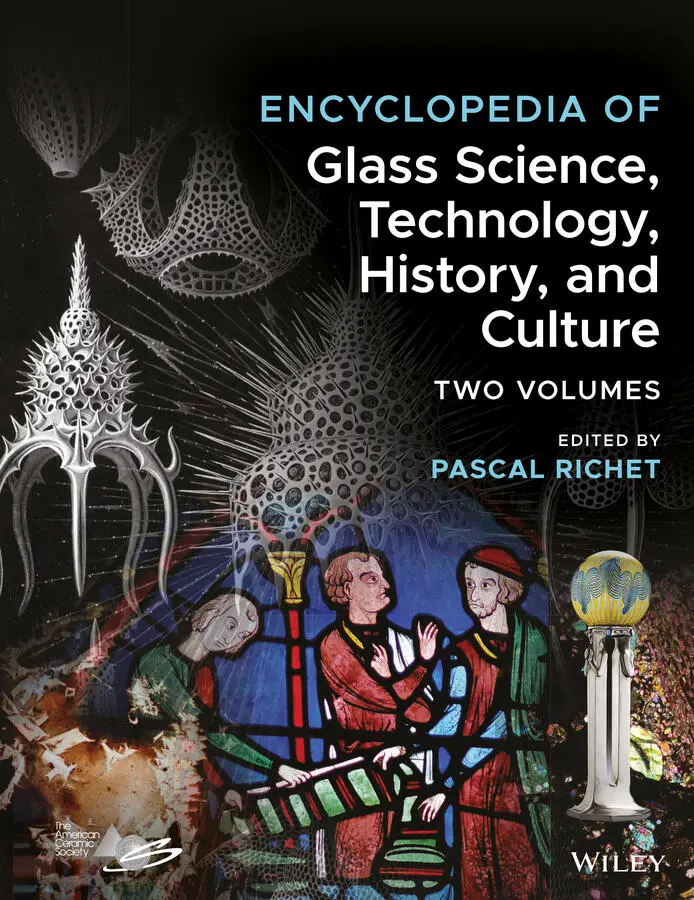
The
has been designed to satisfy the needs and curiosity of a broad audience interested in the most varied aspects of material that is as old as the universe. As described in over 100 chapters and illustrated with 1100 figures, the practical importance of glass has increased over the ages since it was first man-made four millennia ago. The old-age glass vessels and window and stained glass now coexist with new high-tech products that include for example optical fibers, thin films, metallic, bioactive and hybrid organic-inorganic glasses, amorphous ices or all-solid-state batteries.
In the form of scholarly introductions, the Encyclopedia chapters have been written by 151 noted experts working in 23 countries. They present at a consistent level and in a self-consistent manner these industrial, technological, scientific, historical and cultural aspects. Addressing the most recent fundamental advances in glass science and technology, as well as rapidly developing topics such as extra-terrestrial or biogenic glasses, this important guide:
Begins with industrial glassmaking Turns to glass structure and to physical, transport and chemical properties Deals with interactions with light, inorganic glass families and organically related glasses Considers a variety of environmental and energy issues And concludes with a long section on the history of glass as a material from Prehistory to modern glass science The
has been written not only for glass scientists and engineers in academia and industry, but also for material scientists as well as for art and industry historians. It represents a must-have, comprehensive guide to the myriad aspects this truly outstanding state of matter.
Encyclopedia of Glass Science, Technology, History, and Culture — читать онлайн ознакомительный отрывок
Ниже представлен текст книги, разбитый по страницам. Система сохранения места последней прочитанной страницы, позволяет с удобством читать онлайн бесплатно книгу «Encyclopedia of Glass Science, Technology, History, and Culture», без необходимости каждый раз заново искать на чём Вы остановились. Поставьте закладку, и сможете в любой момент перейти на страницу, на которой закончили чтение.
Интервал:
Закладка:
69 Chapter 7.3Figure 1 After the onset of colonization (panel A), biotic glass corrosion m...Figure 2 Putative microbial alteration of glass. (a) TEM image of glass and ...Figure 3 Biologically mediated glass alteration model based on congruent dis...Figure 4 Abiotic alteration ( t 0– t 4, panels A–E). Palagonite rinds form at th...Figure 5 Alteration of sideromelane (basaltic glass) by seawater. (a) SEM im...Figure 6 Corrosion of glass and formation of palagonite by dissolution–repre...Figure 7 Abiotic corrosion of basaltic glass. Palagonite rim initially forms...
70 Chapter 7.4Figure 1 Sketch of the continuous casting process. (a) Ladle, tundish, and m...Figure 2 Sketch of slag/metal entrapment. (a) Metal flow pattern in the mold...Figure 3 Composition ranges for metallurgical slags shown as a ternary diagr...Figure 4 Ellingham diagram: Gibbs free energy of the reactions x M + O 2= M xFigure 5 Values of ln viscosity (dPa s) at 1900 K for various silicates and ...Figure 6 Effect of the polymerization parameter Q on viscosity. (a) Values o...Figure 7 Effect of the polymerization parameter Q on the electrical resistiv...Figure 8 Thermal conductivity of Na 2O–CaO–SiO 2slags of similar composition....
71 Chapter 7.5Figure 1 Process scheme for the productions of water glass and related mater...Figure 2 Ternary diagram Na 2O–SiO 2–H 2O; crystalline Na 2O⋅SiO 2⋅nH 2O with diff...Figure 3 Concentrations of silicate species in equilibrium with colloidal si...Figure 4 Mass content of colloidal size classes measured by dynamic light sc...Figure 5 Effect of dilution with deionized water on the pH of sodium water g...
72 Chapter 7.6Figure 1 The Na 2O·B 2O 3·SiO 2phase diagram, with estimated compositional limi...Figure 2 Coexistence of B(III) and B(IV) in Pyrex glass as clearly revealed ...Figure 3 Variations of boron speciation upon processing of Vycor glass shown...Figure 4 Compositional dependence of fourfold coordinated boron in alkali bo...Figure 5 Effect of Si–B substitution on boron speciation in 17 Na 2O· x B 2O 3·(...Figure 6 11B MAS NMR spectra for (a) a boron‐rich glass with composition 17 ...Figure 7 Increase in the B(IV) fraction in a sodium borosilicate glass upon ...Figure 8 Effects of permanent densification on the boron speciation of two b...
73 Chapter 7.7Figure 1 Different glass container types: ampoule, vial, syringe, and cartri...Figure 2 Distribution of pharmaceutical glass containers in terms of product...Figure 3 Segmentation of the value (€) of the different container types, yea...Figure 4 The Danner and Vello glass‐tubing processes, drawing glass horizont...Figure 5 Forming process from glass tube to vial. The various steps include ...Figure 6 Schematic representation of a glass container production line. Diff...Figure 7 As apparent in a probability plot for vertical breaking of cartridg...Figure 8 Mechanism of glass delamination in pharmaceutical glass vials. Inse...Figure 9 Tungsten residues of the inner surface of a syringe cone as seen as...
74 Chapter 7.8Figure 1 Jänecke's triangular prism for the Y–Si–Al–O–N system showing the c...Figure 2 Bridging of SiO 4tetrahedra. (a) Via a bridging oxygen connecting t...Figure 3 Average number of nitrogen atoms bonded to each silicon as a functi...Figure 4 Linear increases of Young's modulus of oxynitride glasses with incr...Figure 5 Glass‐transition temperature ( T g) of oxynitride glasses increases l...Figure 6 Effect of nitrogen content on viscosity (log scale) for oxynitride ...Figure 7 Schematic plot showing the combined effects of cation field strengt...
75 Chapter 7.9Figure 1 The Q nspeciation of phosphate groups. Resonances indicated by d...Figure 2 Exponential increase in the theoretical chain length of phosphates ...Figure 3 Changes of Q nspeciation as a function of composition apparent i...Figure 4 The dramatic effect of strong modifiers on glass transition tempera...Figure 5 Contrast between the effects of composition on viscosity at high te...Figure 6 Abbe diagram for a range of different glass types (Chapter 6.1), ba...Figure 7 Continuously produced bars of phosphate glass highly doped with neo...
76 Chapter 7.10Figure 1 A typical DSC thermogram of a metallic glass crystallizing though m...Figure 2 Two‐step glass transition of Au 49Cu 26.9Ag 5.5Pd 2.3Si 16.3in heat‐cap...Figure 3 Room‐temperature cell of glassy Fe produced by a molecular‐dynamics...Figure 4 Pair‐distribution function of a Cu–Zr–Ti alloy determined from sync...Figure 5 The first two Gaussian peaks at 298 K of the pair‐distribution func...Figure 6 The structure of Zr 62.5Cu 22.5Fe 5Al 10glass directly observed by ele...Figure 7 Bright‐field transmission electron micrograph showing a two‐phase s...Figure 8 Electron‐microscopy micrographs of a porous Pd 42.5Cu 30Ni 7.5P 20glas...Figure 9 Comparison between the compressive stress–strain curves of porous (...Figure 10 Electron microscopy micrographs of icosahedral quasicrystals in th...Figure 11 The wavy, or serrated , stress‐deformation relationship of a 2 : 1 ...Figure 12 Strain–stress curves of a 1 : 2 (height to diameter ratio) cylinde...Figure 13 Thermal properties of the Zr 62.5Cu 22.5Fe 5Al 10glass cylinders afte...Figure 14 Schematic representation of strain‐rate dependence of the fracture...Figure 15 Stress and stress drops as a function of plastic strain for the cy...Figure 16 Boundary between the amorphous (left) and crystalline (right) phas...Figure 17 The three successive deformation regimes A, B, and C in the strain...Figure 18 A typical magnetization curve of a Fe–Co‐based metallic glass.Figure 19 Scanning electron microscopy microphotographs: (a) and (b) are Si ...Figure 20 The structure of a Zr–Pd metallic nanoglass studied by scanning el...Figure 21 A bulk metallic glass piece: a 5‐cm long Zr–Cu–Fe–Al alloy rod.
77 Chapter 7.11Figure 1 Code 9606 glass‐ceramic, containing cordierite as main crystalline ...Figure 2 The two limiting case of crystal growth in glass [6]. Top: homogene...Figure 3 Crystal nucleation and growth in a lithium aluminosilicate glass as...Figure 4 Diversity of microstructures in terms of crystal sizes and shapes o...Figure 5 Projection along the c axes of the crystal structures of β‐quartz (...Figure 6 Examples of Eurokera products made from glass‐ceramics containing a...Figure 7 Relative transparency of glass‐ceramics produced by Eurokera as ind...Figure 8 Sketch of the machinable glass Fotoform and machinable glass‐cerami...Figure 9 Examples of pieces produced from machinable Macor glass‐ceramic (Co...
78 Section VIIIFigure 1 The astonishing shaping versatility of biogenic amorphous silica: t...
79 Chapter 8.1Figure 1 The extreme morphological variety of diatom frustules and the speci...Figure 2 Haeckel's drawings of radiolarites as a source of architectural ins...Figure 3 The Venus flower basket of the Euplectella aspergillum sponge [8]. Si...Figure 4 The diversity of shapes of phytoliths found in 10 000–5 000‐year ol...Figure 5 The concentric structure of a basalia spicule of the Euplectella as ...Figure 6 Scanning electron micrograph revealing the hierarchical distributio...Figure 7 The 2‐D periodic network of Coscinodiscus sp.Figure 8 Diatomite exploitation in an open‐pit mine at Foufouilloux (Cantal,...
80 Chapter 8.2Figure 1 Range of products that can be prepared via sol–gel processing.Figure 2 Alkoxide sol–gel reactions: hydrolysis; water‐ and alcohol‐forming ...Figure 3 Flowchart of the silica‐titania sol–gel process, with pH ≤ 2.Figure 4 Sol–gel film deposition methods: (a) spin‐coating and (b) dip‐coati...Figure 5 Transmission electron microscopy images of sol–gel silica nanoparti...Figure 6 Examples of sol–gel prepared photonic crystals: (a) Fabry–Perot mic...Figure 7 Scanning electron micrograph of nano/macroporous scaffold for bone ...
Читать дальшеИнтервал:
Закладка:
Похожие книги на «Encyclopedia of Glass Science, Technology, History, and Culture»
Представляем Вашему вниманию похожие книги на «Encyclopedia of Glass Science, Technology, History, and Culture» списком для выбора. Мы отобрали схожую по названию и смыслу литературу в надежде предоставить читателям больше вариантов отыскать новые, интересные, ещё непрочитанные произведения.


Обсуждение, отзывы о книге «Encyclopedia of Glass Science, Technology, History, and Culture» и просто собственные мнения читателей. Оставьте ваши комментарии, напишите, что Вы думаете о произведении, его смысле или главных героях. Укажите что конкретно понравилось, а что нет, и почему Вы так считаете.