Encyclopedia of Glass Science, Technology, History, and Culture
Здесь есть возможность читать онлайн «Encyclopedia of Glass Science, Technology, History, and Culture» — ознакомительный отрывок электронной книги совершенно бесплатно, а после прочтения отрывка купить полную версию. В некоторых случаях можно слушать аудио, скачать через торрент в формате fb2 и присутствует краткое содержание. Жанр: unrecognised, на английском языке. Описание произведения, (предисловие) а так же отзывы посетителей доступны на портале библиотеки ЛибКат.
- Название:Encyclopedia of Glass Science, Technology, History, and Culture
- Автор:
- Жанр:
- Год:неизвестен
- ISBN:нет данных
- Рейтинг книги:3 / 5. Голосов: 1
-
Избранное:Добавить в избранное
- Отзывы:
-
Ваша оценка:
Encyclopedia of Glass Science, Technology, History, and Culture: краткое содержание, описание и аннотация
Предлагаем к чтению аннотацию, описание, краткое содержание или предисловие (зависит от того, что написал сам автор книги «Encyclopedia of Glass Science, Technology, History, and Culture»). Если вы не нашли необходимую информацию о книге — напишите в комментариях, мы постараемся отыскать её.
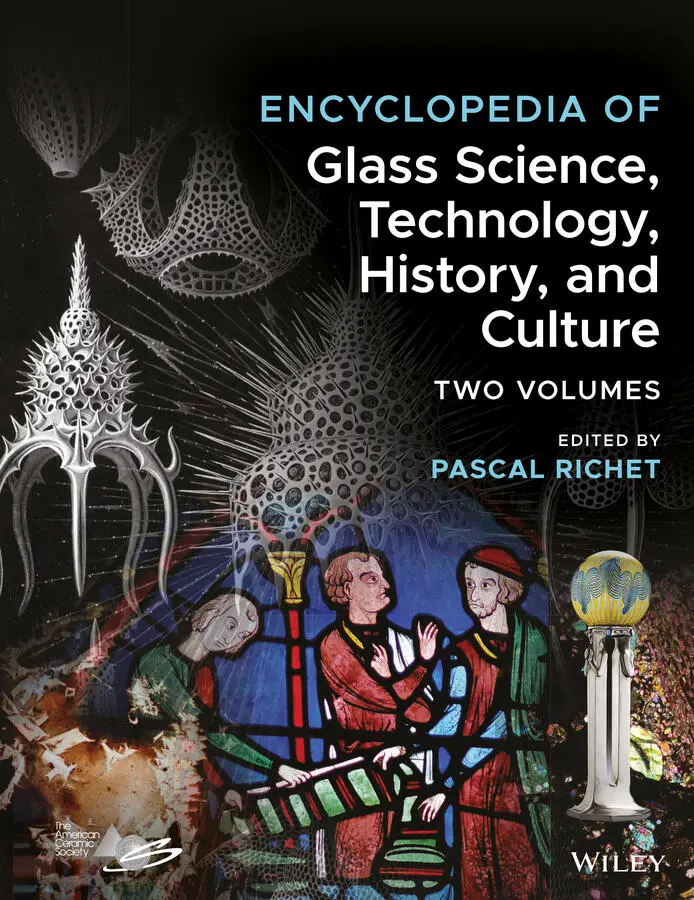
The
has been designed to satisfy the needs and curiosity of a broad audience interested in the most varied aspects of material that is as old as the universe. As described in over 100 chapters and illustrated with 1100 figures, the practical importance of glass has increased over the ages since it was first man-made four millennia ago. The old-age glass vessels and window and stained glass now coexist with new high-tech products that include for example optical fibers, thin films, metallic, bioactive and hybrid organic-inorganic glasses, amorphous ices or all-solid-state batteries.
In the form of scholarly introductions, the Encyclopedia chapters have been written by 151 noted experts working in 23 countries. They present at a consistent level and in a self-consistent manner these industrial, technological, scientific, historical and cultural aspects. Addressing the most recent fundamental advances in glass science and technology, as well as rapidly developing topics such as extra-terrestrial or biogenic glasses, this important guide:
Begins with industrial glassmaking Turns to glass structure and to physical, transport and chemical properties Deals with interactions with light, inorganic glass families and organically related glasses Considers a variety of environmental and energy issues And concludes with a long section on the history of glass as a material from Prehistory to modern glass science The
has been written not only for glass scientists and engineers in academia and industry, but also for material scientists as well as for art and industry historians. It represents a must-have, comprehensive guide to the myriad aspects this truly outstanding state of matter.
Encyclopedia of Glass Science, Technology, History, and Culture — читать онлайн ознакомительный отрывок
Ниже представлен текст книги, разбитый по страницам. Система сохранения места последней прочитанной страницы, позволяет с удобством читать онлайн бесплатно книгу «Encyclopedia of Glass Science, Technology, History, and Culture», без необходимости каждый раз заново искать на чём Вы остановились. Поставьте закладку, и сможете в любой момент перейти на страницу, на которой закончили чтение.
Интервал:
Закладка:
8 Chapter 1.6 Figure 1 History of commercial continuous fiberglass development (most activ... Figure 2 Schematic illustrations of continuous fiberglass manufacturing proc... Figure 3 Differential scanning calorimetry output of E‐glass batches with an... Figure 4 Viscosity curves of E‐glass, E‐CR‐glass, AR‐glass, D‐glass (derivat... Figure 5 Global GRP composite market shares in America, EMEA, and Asia Pacif... Figure 6 Improvement in fiber properties through compositional changes. (a) ...
9 Chapter 1.7 Figure 1 Examples of burner block geometry. (a) Accurate representation with... Figure 2 Example of a screen with small‐scale features requiring a high mesh... Figure 3 Deformed finite element mesh during a simulation of the drawing of ... Figure 4 Fiber radius attenuation: comparison of numerical and experimental ... Figure 5 Sketch of a glass melting furnace for the production of reinforceme... Figure 6 3‐D rendering of temperature contours within a glass furnace heated... Figure 7 Combustion zone of a fiber glass melting furnace. (a) Photo of oxy‐... Figure 8 Results of particle tracking post‐processing: (a) calculated distri... Figure 9 Pathways of sand particles dissolving in glass. Figure 10 Central role of simulation data management in sharing of informati...
10 Section II Figure 1 The atomic disorder of the glass structure (left) giving way to cry...
11 Chapter 2.1 Figure 1 Two‐dimensional representation of a crystal structure for a composi... Figure 2 Two‐dimensional representation of a random network for a compositio... Figure 3 Connection of two corner‐sharing SiO 4/2tetrahedra by a bridging ox... Figure 4 Ball‐and‐stick model constructed by Bell and Dean for SiO 2glass [6... Figure 5 Diffraction results for α ‐quartz and v‐SiO 2. (a) Neutron diffr... Figure 6 Comparison between the Si─Ô─Si bond angle distributions, V ( θ ),... Figure 7 Structural units in network glasses: (a) AO 3/2triangle; (b) AO 3/2... Figure 8 Neutron correlation function for lithium disilicate glass [14]. The... Figure 9 Deviations of the relative abundance of Q n‐species in lithium sil... Figure 10 The two differing effects of the addition of a network modifier ca... Figure 11 Boron‐oxygen coordination number, n BO, for lithium borate glasses,... Figure 12 Germanium‐oxygen coordination number, n GeO, for cesium germanate g... Figure 13 Two‐dimensional representation of the boroxol ring model for the s... Figure 14 Network connectivity for a Ge─Se glass with a composition close to...
12 Chapter 2.2 Figure 1 Structural differences between crystals and glasses revealed by dif... Figure 2 Information drawn for GeO 2glass from diffraction data. (a) Measure... Figure 3 Typical information drawn from XAS spectra: processes causing the f... Figure 4 EXAFS portion of the XAS spectrum of GeO 2glass. (a) Background cor... Figure 5 Information drawn from XANES data. (a) Fourfold coordination of Si ... Figure 6 Structure determinations of sodium silicate glasses from 27Al and 1... Figure 7 Band assignments in infrared absorption spectra of borate glasses o... Figure 8 Band assignments in Raman spectra. (a) In the unpolarized Raman spe... Figure 9 Raman signatures of the different Q species in alkali‐containing si... Figure 10 Evolution of Brillouin spectra with the pressures from which an an... Figure 11 Contributions of Fe 2+(light gray) and Fe 3+(dark gray) to the Mös... Figure 12 The different oxygen species identified from the XPS O 1s spectrum...
13 Chapter 2.3 Figure 1 Interaction volume and main secondary signals occurring when a prim... Figure 2 Scanning electron micrographs of the MAS glass‐ceramic sample: reso... Figure 3 Electron beam paths in the parallel sample illumination mode in TEM... Figure 4 Transmission electron micrographs of the MAS glass ceramics. (a) Br... Figure 5 Working principle of the scanning transmission electron microscope.... Figure 6 Comparisons of TEM and STEM images of ZrO 2crystals in the glassy M... Figure 7 Micrographs of element distribution as determined for the areas sho... Figure 8 Al‐ L 2,3edge EELS spectra of MAS sample areas that represent either... Figure 9 Working principle of the atomic force microscope in the contact mod... Figure 10 Topography (left) and hardness (right) contrasts between spinel an... Figure 11 Three‐dimensional (3‐D) representation of X‐ray microscopy data fr...
14 Chapter 2.4 Figure 1 Oxygen linkages in crystalline and glassy CaTiSiO 5as seen by 17O M... Figure 2 Radial distribution curves derived in an early X‐ray scattering stu... Figure 3 Two‐dimensional sketch of a mixed network oxide glass such as B 2O 3–... Figure 4 Two‐dimensional representation of the modification of a glass netwo... Figure 5 Silicate structural groups in a high‐pressure, triclinic crystallin... Figure 6 Optical spectra for glasses in which Ni 2+coordination changes from... Figure 7 Partial pair distribution functions g ij( r ) calculated from a “rever...
15 Chapter 2.5 Figure 1 Visualizing the extended atomic structure characteristic of glass. ... Figure 2 Contrast between the radially averaged local structure T ( r ) of dire... Figure 3 Contrast between the network structure of SiO 2(a) and the metallic... Figure 4 Visualization of MD simulations of two tetrahedral glasses with vas... Figure 5 The collective atomic vibrations involved in the boson peak observe... Figure 6 Direct observation of the atomic structures of glasses. (a) Atomic ... Figure 7 Simple two‐dimensional models of glass structure created from spars... Figure 8 Microsegregation in network glasses. (a) Modified random network (M...
16 Chapter 2.6 Figure 1 Compositional environment of complex silicate melts and glasses. Pe... Figure 2 Distribution of intertetrahedral angle, ∠(Si–O–Si) o, in SiO 2glass ... Figure 3 Energetics of Al,Si substitution along meta‐aluminosilicate joins a... Figure 4 Summary of distribution of charge‐balancing cations (Na ++ K +and C... Figure 5 Calculated distribution of NBO/T‐values of major groups of natural ... Figure 6 Distribution of network‐modifying cations (Na +, Ca 2+, and Mg 2+) in ... Figure 7 Abundance evolution (mol %) of Q 2, Q 3, and Q 4species in alkali ... Figure 8 Enthalpy change, ∆ H , for the disproportionation equilibrium, 2 Q n Figure 9 Activation energy of viscous flow of aluminosilicate melts along th... Figure 10 Distribution of redox ratio of iron (Fe 3+/∑Fe) among various commo... Figure 11 Activity coefficient ratio of Fe 2+and Fe 3+in CaO─SiO 2glasses fo...
17 Chapter 2.7 Figure 1 Deformation of a finite network of four nodes. Lines represent line... Figure 2 Schematic of a Se‐chain with five seleniums connecting two Ge atoms... Figure 3 Schematic variation of degrees of freedom ( f ) in three supercooled ... Figure 4 Composition dependence of the glass transition temperature for the ... Figure 5 Variation of fragility with composition in the (a) sodium borate an... Figure 6 Contrast between strong (SiO 2) and highly fragile (O‐Terphenyl, OTP...
18 Chapter 2.8 Figure 1 Schematic representation of periodic boundary conditions. Figure 2 Examples of potential energy models: Morse and Buckingham potential... Figure 3 As defined by Eq. (20), total correlation functions T ( r ) of Mg 2SiO 4 Figure 4 Comparisons between the experimental [13] and simulated [6] X‐ray (... Figure 5 Comparisons between the experimental [13] and simulated [6] X‐ray (... Figure 6 PDF functions in simulated B 2O 3glass and their structural assignme... Figure 7 Bond angle distribution in simulated B 2O 3glass. Figure 8 Torsion angle distribution in simulated B 2O 3glass between BO 3and ... Figure 9 Ring size distribution in simulated B 2O 3and SiO 2glasses [11]. Dat... Figure 10 Vibrational density of states in simulated B 2O 3glass [6]. See tex...
Читать дальшеИнтервал:
Закладка:
Похожие книги на «Encyclopedia of Glass Science, Technology, History, and Culture»
Представляем Вашему вниманию похожие книги на «Encyclopedia of Glass Science, Technology, History, and Culture» списком для выбора. Мы отобрали схожую по названию и смыслу литературу в надежде предоставить читателям больше вариантов отыскать новые, интересные, ещё непрочитанные произведения.


Обсуждение, отзывы о книге «Encyclopedia of Glass Science, Technology, History, and Culture» и просто собственные мнения читателей. Оставьте ваши комментарии, напишите, что Вы думаете о произведении, его смысле или главных героях. Укажите что конкретно понравилось, а что нет, и почему Вы так считаете.