Spectroscopy for Materials Characterization
Здесь есть возможность читать онлайн «Spectroscopy for Materials Characterization» — ознакомительный отрывок электронной книги совершенно бесплатно, а после прочтения отрывка купить полную версию. В некоторых случаях можно слушать аудио, скачать через торрент в формате fb2 и присутствует краткое содержание. Жанр: unrecognised, на английском языке. Описание произведения, (предисловие) а так же отзывы посетителей доступны на портале библиотеки ЛибКат.

- Название:Spectroscopy for Materials Characterization
- Автор:
- Жанр:
- Год:неизвестен
- ISBN:нет данных
- Рейтинг книги:5 / 5. Голосов: 1
-
Избранное:Добавить в избранное
- Отзывы:
-
Ваша оценка:
Spectroscopy for Materials Characterization: краткое содержание, описание и аннотация
Предлагаем к чтению аннотацию, описание, краткое содержание или предисловие (зависит от того, что написал сам автор книги «Spectroscopy for Materials Characterization»). Если вы не нашли необходимую информацию о книге — напишите в комментариях, мы постараемся отыскать её.
Learn foundational and advanced spectroscopy techniques from leading researchers in physics, chemistry, surface science, and nanoscience Spectroscopy for Materials Characterization,
Simonpietro Agnello
Spectroscopy for Materials Characterization
Spectroscopy for Materials Characterization — читать онлайн ознакомительный отрывок
Ниже представлен текст книги, разбитый по страницам. Система сохранения места последней прочитанной страницы, позволяет с удобством читать онлайн бесплатно книгу «Spectroscopy for Materials Characterization», без необходимости каждый раз заново искать на чём Вы остановились. Поставьте закладку, и сможете в любой момент перейти на страницу, на которой закончили чтение.
Интервал:
Закладка:
The SPM is the effect related to the temporal dependence of beam intensity and, in particular, to the variations of the phase of the pulse. The applied field can be written as:
(3.9) 
Therefore, the instantaneous phase of the pulse depends on time as:
(3.10) 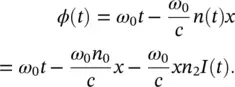
Considering the instantaneous frequency ω ( t ):
(3.11) 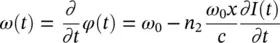
the last term implies a change (self‐modulation) of the frequency of the propagating light in a way controlled by the intensity envelope of the pulse itself. This effect causes the introduction of new frequencies in the spectrum of the pulse, symmetrically higher and lower than ω 0according to the alternating signs of  in a Gaussian pulse ( Figure 3.2).
A discussion of SPM, however, cannot be disentangled from the effects of SF. In fact, SF occurs in parallel to SPM because of the spatial dependence of the intensity in the pulse, which, for a Gaussian beam, is much stronger in the center of the beam than the sides. For this reason, the beam is capable of modifying the local refractive index, making it higher at the center of the beam if n 2> 0. This causes a focusing of the beam along its path, because the region of modified refractive index behaves as a lens.
In laboratory practice, SF is easily observed by prefocusing by an ordinary lens an intense femtosecond laser beam (at least a few μJ per pulse) to a spot of a few tens of μm within a transparent medium with significant χ (3), such as ordinary glass, a water cell, or crystals such as sapphire. Focusing the beam allows to reach a threshold intensity above which the onset of SF occurs. As a consequence, the beam spontaneously shrinks down to a filament with much smaller (a few μm) cross section, within a few millimeters of propagation length. In practice, SF stops when the diameter of the filament is so small (a few μm) that the diffraction is strong enough to balance the effect and prevent further self‐focusing. Obviously, self‐focusing causes a dramatic increase in the local intensity of the electric field. Thereby, SPM is strongly enhanced within the filament, strongly contributing to a dramatic broadening of the pulse spectrum and to the generation of an intense white light. Therefore, the formation of a stable filament is essential to have a stable and intense white light pulse. The final output of these processes is a spectral broad pulse as a consequence of combined SPM and SF, and it is also temporally broad and strongly chirped as a consequence of group velocity dispersion (GVD), as depicted in Figure 3.2. For instance, if the white light is generated from a 800 nm beam passing through a 2 mm cuvette of D 2O, the pulse covers a very broad range which is symmetric with respect to 800 nm, from which the visible part can be then selected by a filter ( Figure 3.2).
3.3 Transient Absorption Spectroscopy
Ultrafast transient absorption (TA), or pump/probe, spectroscopy is a nonlinear spectroscopic method based on measuring the changes in the absorption spectrum of a system following an external excitation [827–32]. In a TA experiment, the sample is photoexcited by a femtosecond pulse called pump and the variations of the absorption spectrum are measured by another, delayed, ultrafast pulse named probe . The probe is usually spectrally broad (400–700 nm) and this allows to record simultaneously the changes of the absorption spectrum in a wide spectral range. Moreover, the variations in the entire spectrum are recorded at different time delays between the two pulses, yielding kinetic traces of the time‐dependent absorption coefficient at every wavelength.
In these experiments, the pump pulse is normally resonant to one of the electronic transitions of the sample, in order to bring it from the ground state to an upper energy state. Then, the instrument records the intensity of a probe light pulse which has traversed, at certain delay after the excitation, the excited spot on the sample, and compares this with the result of an identical measurement without the pump pulse. As explained hereafter, the TA signal is obtained from the ratio between the probe intensities recorded with and without excitation.
3.3.1 The Experimental Method
If we indicate with I uand I pthe probe light intensities transmitted through the unexcited ( u ) and photoexcited ( p ) sample, and writing the number of absorbers in the system as N 0= N g+ N e, that is the sum of non‐excited ( N g) and excited absorbers ( N e), the Beer–Lambert law can be used to express I uand I pin terms of the variation Δ σ of the attenuation cross section:
(3.12) 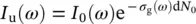
(3.13) 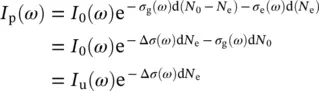
(3.14) 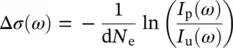
where σ gand σ eare the attenuation cross sections in the ground and excited state, respectively, Δ σ = σ e− σ g, and d is the sample thickness. In practice, the recorded TA signal is most commonly expressed as a differential optical density ΔOD, which is indeed proportional to the change in cross section: ΔOD = Δ σ d N e/2.303. Thus, the TA signal is given by:
(3.15) 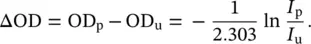
This is the quantity that is experimentally obtained from I uand I pgenerally reported in a TA experiment. Considering that the variation of the absorption is normally very small, I p− I u<< I u, it is possible to linearize Eq. (3.15)and calculate the TA signal as:
(3.16) 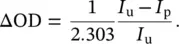
In general, ΔOD( ω ) is the superposition of three types of contributions: ground state bleaching (GSB), stimulated emission (SE), and excited state absorption (ESA). Their nature is illustrated in Figure 3.3using a molecular system with three electronic levels as an example. Similar considerations apply to molecules with more than three levels, or to other types of physical systems, such as bulk solids or nanoparticles.
GSB is the negative TA signal related to the depopulation of the ground state upon pumping. After pumping, photoexcited molecules are no more in the ground state and they cannot contribute anymore to the ground state absorption. Therefore, the probe is less absorbed in the spectral range of the 0 → 1 transition (see Figure 3.3) and this appears as a negative signal in the TA spectrum, resembling one or more of the steady state absorption bands.
Читать дальшеИнтервал:
Закладка:
Похожие книги на «Spectroscopy for Materials Characterization»
Представляем Вашему вниманию похожие книги на «Spectroscopy for Materials Characterization» списком для выбора. Мы отобрали схожую по названию и смыслу литературу в надежде предоставить читателям больше вариантов отыскать новые, интересные, ещё непрочитанные произведения.


Обсуждение, отзывы о книге «Spectroscopy for Materials Characterization» и просто собственные мнения читателей. Оставьте ваши комментарии, напишите, что Вы думаете о произведении, его смысле или главных героях. Укажите что конкретно понравилось, а что нет, и почему Вы так считаете.