Spectroscopy for Materials Characterization
Здесь есть возможность читать онлайн «Spectroscopy for Materials Characterization» — ознакомительный отрывок электронной книги совершенно бесплатно, а после прочтения отрывка купить полную версию. В некоторых случаях можно слушать аудио, скачать через торрент в формате fb2 и присутствует краткое содержание. Жанр: unrecognised, на английском языке. Описание произведения, (предисловие) а так же отзывы посетителей доступны на портале библиотеки ЛибКат.

- Название:Spectroscopy for Materials Characterization
- Автор:
- Жанр:
- Год:неизвестен
- ISBN:нет данных
- Рейтинг книги:5 / 5. Голосов: 1
-
Избранное:Добавить в избранное
- Отзывы:
-
Ваша оценка:
Spectroscopy for Materials Characterization: краткое содержание, описание и аннотация
Предлагаем к чтению аннотацию, описание, краткое содержание или предисловие (зависит от того, что написал сам автор книги «Spectroscopy for Materials Characterization»). Если вы не нашли необходимую информацию о книге — напишите в комментариях, мы постараемся отыскать её.
Learn foundational and advanced spectroscopy techniques from leading researchers in physics, chemistry, surface science, and nanoscience Spectroscopy for Materials Characterization,
Simonpietro Agnello
Spectroscopy for Materials Characterization
Spectroscopy for Materials Characterization — читать онлайн ознакомительный отрывок
Ниже представлен текст книги, разбитый по страницам. Система сохранения места последней прочитанной страницы, позволяет с удобством читать онлайн бесплатно книгу «Spectroscopy for Materials Characterization», без необходимости каждый раз заново искать на чём Вы остановились. Поставьте закладку, и сможете в любой момент перейти на страницу, на которой закончили чтение.
Интервал:
Закладка:
(1.109) 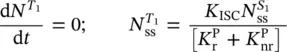
which can be substituted into (1.106)and (1.107)to obtain
(1.110) 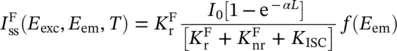
(1.111) 
Apart from the dependence on the rate of transitions, these equations show that the emission intensities of both fluorescence and phosphorescence depend on the absorption process. In this context, in the case of low absorption, it is found that (1 – e −αL) ~ αL . Since the absorption coefficient is a function of the excitation energy, both Eqs. (1.110)and (1.111)enable to determine α ( E exc) when the E emis fixed and to reconstruct the absorption profile. This kind of measurement is known as excitation spectrum [2, 18] and enables to determine the connection between the spectra of phosphorescence and fluorescence, relating them to the same absorption pathway, and to reconstruct the Jablonski diagram.
Finally, in analogy to Eq. (1.70), when the excitation light is suddenly removed, Eqs. (1.104)and (1.105)enable to determine the lifetime of fluorescence and of phosphorescence and to demonstrate that they are, respectively [18]:
(1.112) 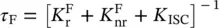
(1.113) 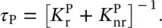
Considering the temperature dependence of the non‐radiative processes and their rate, these equations show that a lifetime dependence on temperature is present and that at low T the non‐radiative rates are canceled, enabling to evaluate the true radiative rate [18].
1.3 Instrumental Setups
The instrumentation used and the opportune choice of instrumental features strongly determine the results of a spectroscopy measurement. This paragraph is devoted to summarize the main components of the instrumentation and those technical features that distinguish them aiming to give the basis for an aware choice of parameters during an experiment or the opportunity to choose a good instrumental configuration for carrying out an appropriate experiment.
1.3.1 Typical Block Diagram of Spectrometers
In spectroscopy experiments, radiation–matter interaction is the fundamental process that should be investigated by the instrument. In every instrument, a source of radiation is needed and then, to analyze the effect, the radiation should be selected in terms of energy, or wavelength, and the influence on the sample to be investigated should be detected. Typical block diagrams for simple absorption and emission instruments are reported in Figure 1.7.
In a typical absorption experiment, a light source generates the electromagnetic wave. This is directed to a monochromator that is able to select a given wavelength (energy) of the lightwave within an opportune interval (bandwidth), depending on the construction parameters. The light impinges then on the sample that is opportunely inserted in its path. The light emerging from the sample is detected by a detector and its intensity is registered by a computer (not reported). As reported in Section 1.1.1, comparing the source intensity without the sample ( I 0( λ )) and that after the passage through the sample ( I t( λ )), an absorption measurement can be carried out. This kind of setup is known as single‐beam spectrophotometer and it needs a couple of measurements to record I 0( λ ) and I t( λ ). In some systems, a beam splitter is inserted before the sample to split the lightwave in two identical rays (see dashed path in Figure 1.7). This system is known as double‐beam spectrometer and uses the unperturbed ray as a reference to record I 0( λ ) and the ray passing through the sample to “contemporarily” detect I t( λ ). In this case, a great advantage is usually obtained by using a single detector to avoid mismatches of the spectral response of the detecting system [2, 10].
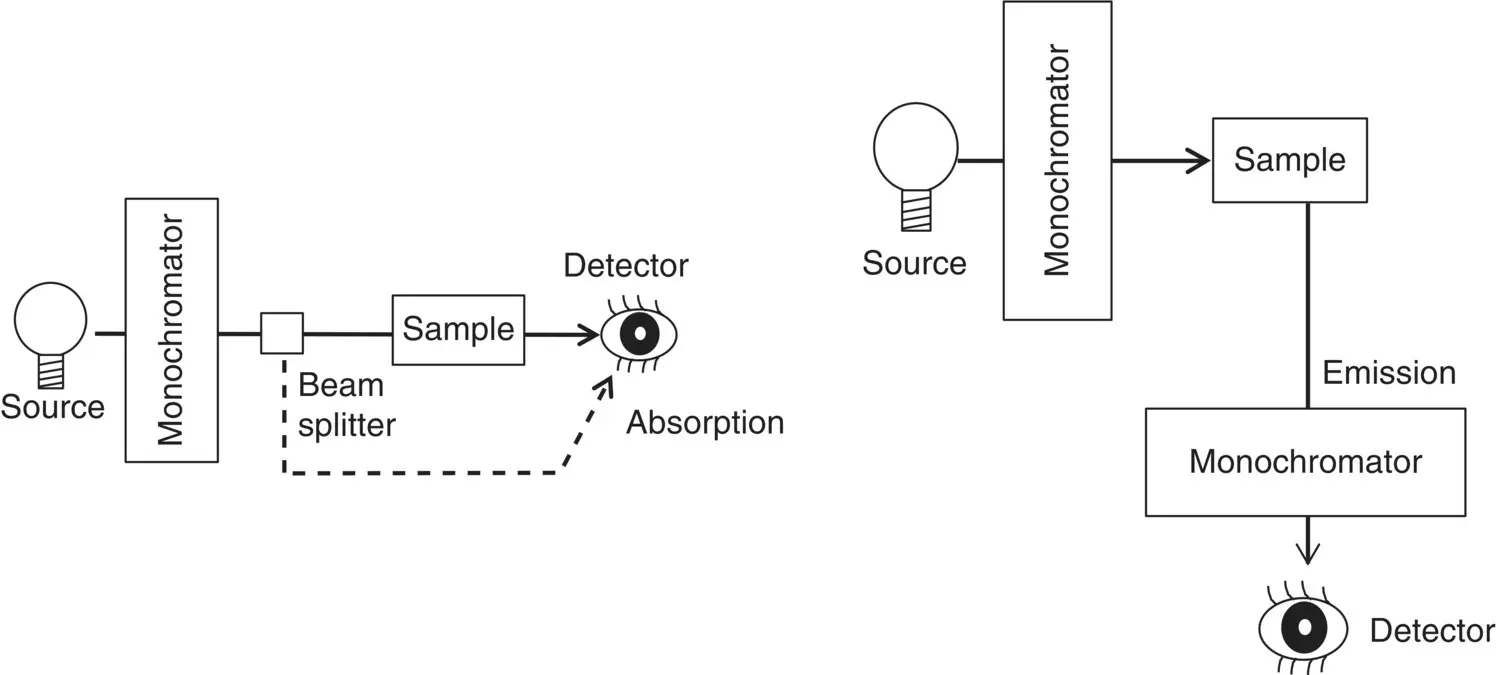
Figure 1.7Pictorial representation of the instrumentations to carry out spectroscopy experiments. On the left, the components of an absorption spectrophotometer consisting of a light source, an entrance monochromator, the sample, and a detector are drawn. The double beam configuration is sketched by the beam splitter and the dashed arrow representing the reference beam. On the right, the scheme for an emission spectrofluorometer shows the additional exit monochromator and the side detector to record the emitted light.
In the photoluminescence experiment, a spectrofluorometer is used where the source of radiation is placed before one monochromator (entrance) to select the wavelength (energy) to excite the sample. When an emission process is active, this is typically isotropic in space and the emitted light can be recorded everywhere. Usually, to avoid any interference with the transmitted light, the emission is recorded in the 90° geometry shown in Figure 1.7or, seldom, in backscattering geometry (the emitted light is recorded in the same direction as the exciting light, the impinging and emerging rays form 180° angle, not reported). To determine the characteristics of the emitted light, a second monochromator (exit) is inserted after the sample to select the wavelength (energy) of the light. Finally, a detector is inserted that is connected to a computer (not reported).
1.3.2 Light Sources
The first element of a spectrometer, as shown in Figure 1.7, is the light source. Different types of sources are usually employed in ultraviolet‐visible‐infrared (UV‐Vis‐IR) spectroscopy [2, 10, 22].
Incandescent lamp: it consists in a metallic filament (typically tungsten) inside a transparent glass bulb filled by halogen gas to maintain the filament. The filament is traversed by an electric current heating it by Joule effect and increasing its temperature [10]. A black body‐like emission occurs, giving a continuous spectrum comprising typically the Vis‐IR range.
Discharge arc lamp: a couple of electrodes (anode and cathode) are inserted in a transparent glass bulb filled by a low‐pressure gas of a given element (e.g. H, Hg, Na, Xe). By applying a high voltage (~1000 V) to the electrodes, a discharge occurs through the gas ionizing it. The ionized gas emits characteristic lines by the transition of the electrons through the excited states of the element. The ensuing spectrum is a line spectrum with a continuous background related to the temperature and the pressure of the gas. It is usual, for spectroscopy, to use high‐pressure discharge lamps to enhance the continuous background and employ them in a large spectral range. In particular, lamps with Xe are used for UV‐Vis emission spectroscopy and with Deuterium for UV and up to vacuum‐UV absorption and emission.
Laser [10]: various types of laser light are employed for spectroscopy due to their precise wavelength, spatial collimation, high intensity and time resolution in the pulsed regime [23]. These systems are realized with opportune cavities with reflecting walls to obtain the lasing effect.
Читать дальшеИнтервал:
Закладка:
Похожие книги на «Spectroscopy for Materials Characterization»
Представляем Вашему вниманию похожие книги на «Spectroscopy for Materials Characterization» списком для выбора. Мы отобрали схожую по названию и смыслу литературу в надежде предоставить читателям больше вариантов отыскать новые, интересные, ещё непрочитанные произведения.


Обсуждение, отзывы о книге «Spectroscopy for Materials Characterization» и просто собственные мнения читателей. Оставьте ваши комментарии, напишите, что Вы думаете о произведении, его смысле или главных героях. Укажите что конкретно понравилось, а что нет, и почему Вы так считаете.