Joseph Schmuller - Statistical Analysis with Excel For Dummies

Здесь есть возможность читать онлайн «Joseph Schmuller - Statistical Analysis with Excel For Dummies» — ознакомительный отрывок электронной книги совершенно бесплатно, а после прочтения отрывка купить полную версию. В некоторых случаях можно слушать аудио, скачать через торрент в формате fb2 и присутствует краткое содержание. Жанр: unrecognised, на английском языке. Описание произведения, (предисловие) а так же отзывы посетителей доступны на портале библиотеки ЛибКат.

Statistical Analysis with Excel For Dummies: краткое содержание, описание и аннотация

Предлагаем к чтению аннотацию, описание, краткое содержание или предисловие (зависит от того, что написал сам автор книги «Statistical Analysis with Excel For Dummies»). Если вы не нашли необходимую информацию о книге — напишите в комментариях, мы постараемся отыскать её.

Become a stats superstar by using Excel to reveal the powerful secrets of statistics  Microsoft Excel offers numerous possibilities for statistical analysis—and you don’t have to be a math wizard to unlock them. In 
fully updated for the 2021 version of Excel, you’ll hit the ground running with straightforward techniques and practical guidance to unlock the power of statistics in Excel.
Bypass unnecessary jargon and skip right to mastering formulas, functions, charts, probabilities, distributions, and correlations. Written for professionals and students without a background in statistics or math, you’ll learn to create, interpret, and translate statistics—and have fun doing it! 
In this book you’ll find out how to: 
Understand, describe, and summarize any kind of data, from sports stats to sales figures Confidently draw conclusions from your analyses, make accurate predictions, and calculate correlations Model the probabilities of future outcomes based on past data Perform statistical analysis on any platform: Windows, Mac, or iPad Access additional resources and practice templates through Dummies.com For anyone who’s ever wanted to unleash the full potential of statistical analysis in Excel—and impress your colleagues or classmates along the way—
 walks you through the foundational concepts of analyzing statistics and the step-by-step methods you use to apply them.
Statistical Analysis with Excel For Dummies — читать онлайн ознакомительный отрывок

Ниже представлен текст книги, разбитый по страницам. Система сохранения места последней прочитанной страницы, позволяет с удобством читать онлайн бесплатно книгу «Statistical Analysis with Excel For Dummies», без необходимости каждый раз заново искать на чём Вы остановились. Поставьте закладку, и сможете в любой момент перейти на страницу, на которой закончили чтение.

Тёмная тема
Сбросить

Интервал:

Закладка:

Сделать

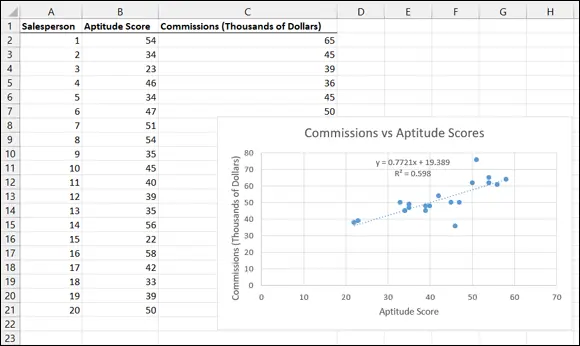
Suppose you're trying to find out how well a test of aptitude for sales predicts salespeople's productivity. You administer the test to a sample of salespersons and you tabulate how much money they make in commissions over a 2-month period. Each person's pair of scores (test score and commissions) locates that person within the scatterplot.

To create a scatterplot, follow these steps:

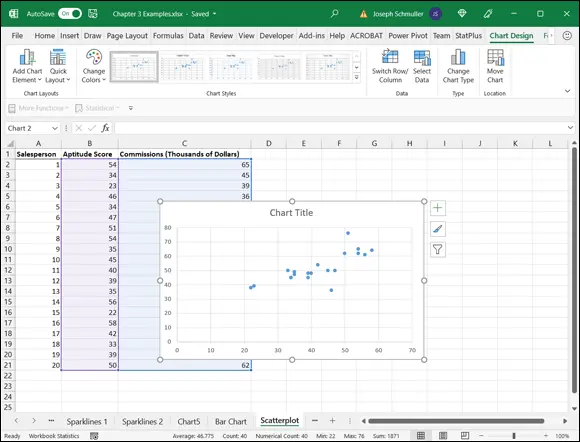
1 Enter your data into a worksheet.Figure 3-24 shows the entered data. FIGURE 3-24:Your scatterplot data.

2 Select the data that go into the chart.In the background of Figure 3-25, you can see the selected cells — B2 through C21. (Including B1 creates the same chart, but with an incorrect title.) The cells in Column A are just placeholders that organize the data.

3 Choose Insert | Recommended Charts from the main menu and then select the chart type from the list on the left of the screen.I chose the first option, resulting in the chart shown in Figure 3-25.

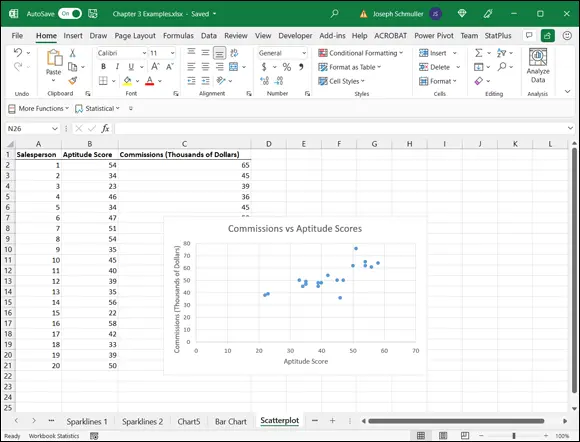
4 Modify the chart.I clicked the generic chart title and typed a new title. Next, I clicked the Chart Elements tool (labeled with a plus sign) and used the resulting menu to add generic axis titles to the chart. I then typed new titles. Finally, I selected each axis title and typed Ctrl+B to turn the font bold. I did that for the chart title, too. The result is the scatterplot in Figure 3-26.

FIGURE 325The initial scatterplot FIGURE 326The almostfinished - фото 121

FIGURE 3-25:The initial scatterplot.

FIGURE 326The almostfinished scatterplot For the other graphs that would - фото 122

FIGURE 3-26:The almost-finished scatterplot.

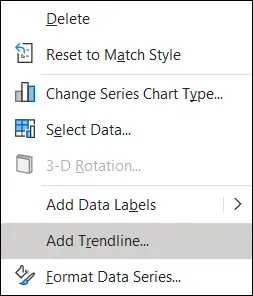
For the other graphs, that would just about do it, but this one's special. Right-clicking any of the points in the scatterplot opens the pop-up menu shown in Figure 3-27.

FIGURE 327Rightclicking any point on the scatterplot opens this menu - фото 123

FIGURE 3-27:Right-clicking any point on the scatterplot opens this menu.

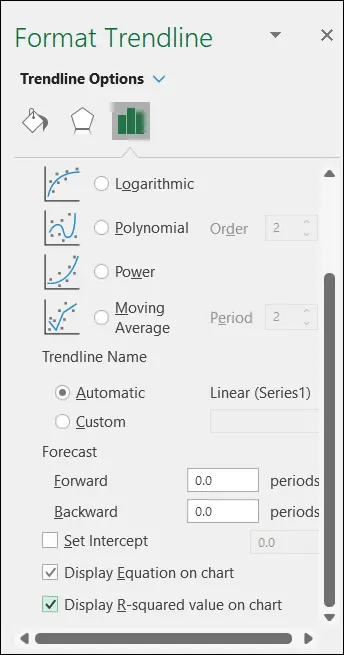
Choosing Add Trendline opens the Format Trendline pane. (See Figure 3-28.) I selected the Linear radio button (the default) and clicked the two check boxes at the bottom. (You have to scroll down to see them.) They’re labeled Display Equation on Chart and Display R-Squared Value on Chart.

FIGURE 328The Format Trendline pane Clicking the Close button closes the - фото 124

FIGURE 3-28:The Format Trendline pane.

Clicking the Close button closes the Format Trendline pane. A couple of additional items are now on the scatterplot, as Figure 3-29 shows. A line passes through the points. Excel refers to it as a trendline, but it's more accurately called a regression line. A couple of equations are there, too. (For clarity, I dragged them from their original locations.) What do they mean? What are those numbers all about?

FIGURE 329The scatterplot with additional information Read Chapter 14to - фото 125

FIGURE 3-29:The scatterplot, with additional information.

Read Chapter 14to find out.

Finding Another Use for the Scatter Chart

In addition to the application in the preceding section, you use the scatter chart to create something like a line chart. The conventional line chart works when the values on the x- axis are equally spaced, as is the case for the data in Table 3-1.

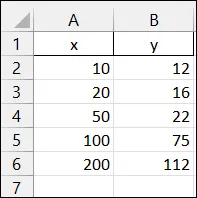
Suppose that your data look like the values in Figure 3-30. Veterans of earlier Excel versions (Excel 2010 and before) might remember having to figure out that a scatter chart with lines and markers was the best way to visualize these data.

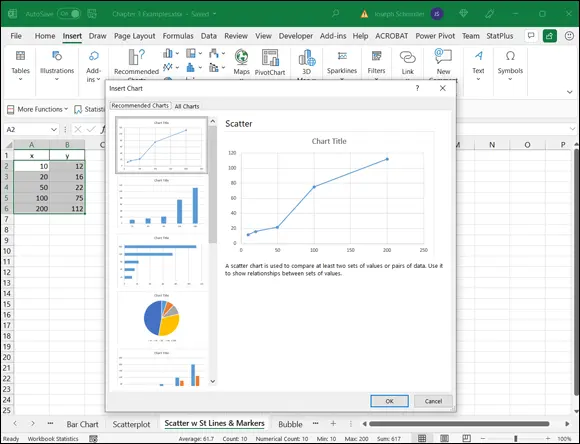
Excel now figures this out for you. Selecting the data and choosing Insert | Recommended Charts presents the Scatter with Straight Lines and Markers as the first option — although Excel labels it simply as Scatter. (See Figure 3-31.) This puts you on the road to the appropriate chart.

FIGURE 330These data suggest a line chart but the x values arent equally - фото 126

FIGURE 3-30:These data suggest a line chart, but the x- values aren’t equally spaced.

Statistical Analysis with Excel For Dummies - изображение 127

FIGURE 3-31:Recommended Charts suggests the appropriate chart for the data.

Statistical Analysis with Excel For Dummies - изображение 128In Chapters 8, 10, 11, and 19, I show you still another use for the scatter chart. In those chapters, I apply Scatter with Smooth Lines. Stay tuned.

Конец ознакомительного фрагмента.

Текст предоставлен ООО «ЛитРес».

Прочитайте эту книгу целиком, купив полную легальную версию на ЛитРес.

Безопасно оплатить книгу можно банковской картой Visa, MasterCard, Maestro, со счета мобильного телефона, с платежного терминала, в салоне МТС или Связной, через PayPal, WebMoney, Яндекс.Деньги, QIWI Кошелек, бонусными картами или другим удобным Вам способом.

Тёмная тема
Сбросить

Интервал:

Закладка:

Сделать

Похожие книги на «Statistical Analysis with Excel For Dummies»

Представляем Вашему вниманию похожие книги на «Statistical Analysis with Excel For Dummies» списком для выбора. Мы отобрали схожую по названию и смыслу литературу в надежде предоставить читателям больше вариантов отыскать новые, интересные, ещё непрочитанные произведения.


Отзывы о книге «Statistical Analysis with Excel For Dummies»

Обсуждение, отзывы о книге «Statistical Analysis with Excel For Dummies» и просто собственные мнения читателей. Оставьте ваши комментарии, напишите, что Вы думаете о произведении, его смысле или главных героях. Укажите что конкретно понравилось, а что нет, и почему Вы так считаете.

x