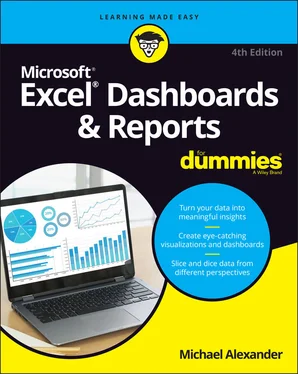
Michael Alexander - Excel Dashboards & Reports For Dummies
Здесь есть возможность читать онлайн «Michael Alexander - Excel Dashboards & Reports For Dummies» — ознакомительный отрывок электронной книги совершенно бесплатно, а после прочтения отрывка купить полную версию. В некоторых случаях можно слушать аудио, скачать через торрент в формате fb2 и присутствует краткое содержание. Жанр: unrecognised, на английском языке. Описание произведения, (предисловие) а так же отзывы посетителей доступны на портале библиотеки ЛибКат.
- Название:Excel Dashboards & Reports For Dummies
- Автор:
- Жанр:
- Год:неизвестен
- ISBN:нет данных
- Рейтинг книги:3 / 5. Голосов: 1
-
Избранное:Добавить в избранное
- Отзывы:
-
Ваша оценка:
- 60
- 1
- 2
- 3
- 4
- 5
Excel Dashboards & Reports For Dummies: краткое содержание, описание и аннотация
Предлагаем к чтению аннотацию, описание, краткое содержание или предисловие (зависит от того, что написал сам автор книги «Excel Dashboards & Reports For Dummies»). Если вы не нашли необходимую информацию о книге — напишите в комментариях, мы постараемся отыскать её.
Excel Dashboards & Reports For Dummies
Excel Dashboards & Reports For Dummies
Excel Dashboards & Reports For Dummies
Excel Dashboards & Reports For Dummies — читать онлайн ознакомительный отрывок
Ниже представлен текст книги, разбитый по страницам. Система сохранения места последней прочитанной страницы, позволяет с удобством читать онлайн бесплатно книгу «Excel Dashboards & Reports For Dummies», без необходимости каждый раз заново искать на чём Вы остановились. Поставьте закладку, и сможете в любой момент перейти на страницу, на которой закончили чтение.
Интервал:
Закладка:

Microsoft® Excel® Dashboards & Reports For Dummies®, 4th Edition
Published by: John Wiley & Sons, Inc.,111 River Street, Hoboken, NJ 07030-5774, www.wiley.com
Copyright © 2022 by John Wiley & Sons, Inc., Hoboken, New Jersey
Published simultaneously in Canada
No part of this publication may be reproduced, stored in a retrieval system or transmitted in any form or by any means, electronic, mechanical, photocopying, recording, scanning or otherwise, except as permitted under Sections 107 or 108 of the 1976 United States Copyright Act, without the prior written permission of the Publisher. Requests to the Publisher for permission should be addressed to the Permissions Department, John Wiley & Sons, Inc., 111 River Street, Hoboken, NJ 07030, (201) 748-6011, fax (201) 748-6008, or online at http://www.wiley.com/go/permissions .
Trademarks:Wiley, For Dummies, the Dummies Man logo, Dummies.com, Making Everything Easier, and related trade dress are trademarks or registered trademarks of John Wiley & Sons, Inc. and may not be used without written permission. Microsoft and Excel are registered trademarks of Microsoft Corporation. All other trademarks are the property of their respective owners. John Wiley & Sons, Inc. is not associated with any product or vendor mentioned in this book.
LIMIT OF LIABILITY/DISCLAIMER OF WARRANTY: WHILE THE PUBLISHER AND AUTHORS HAVE USED THEIR BEST EFFORTS IN PREPARING THIS WORK, THEY MAKE NO REPRESENTATIONS OR WARRANTIES WITH RESPECT TO THE ACCURACY OR COMPLETENESS OF THE CONTENTS OF THIS WORK AND SPECIFICALLY DISCLAIM ALL WARRANTIES, INCLUDING WITHOUT LIMITATION ANY IMPLIED WARRANTIES OF MERCHANTABILITY OR FITNESS FOR A PARTICULAR PURPOSE. NO WARRANTY MAY BE CREATED OR EXTENDED BY SALES REPRESENTATIVES, WRITTEN SALES MATERIALS OR PROMOTIONAL STATEMENTS FOR THIS WORK. THE FACT THAT AN ORGANIZATION, WEBSITE, OR PRODUCT IS REFERRED TO IN THIS WORK AS A CITATION AND/OR POTENTIAL SOURCE OF FURTHER INFORMATION DOES NOT MEAN THAT THE PUBLISHER AND AUTHORS ENDORSE THE INFORMATION OR SERVICES THE ORGANIZATION, WEBSITE, OR PRODUCT MAY PROVIDE OR RECOMMENDATIONS IT MAY MAKE. THIS WORK IS SOLD WITH THE UNDERSTANDING THAT THE PUBLISHER IS NOT ENGAGED IN RENDERING PROFESSIONAL SERVICES. THE ADVICE AND STRATEGIES CONTAINED HEREIN MAY NOT BE SUITABLE FOR YOUR SITUATION. YOU SHOULD CONSULT WITH A SPECIALIST WHERE APPROPRIATE. FURTHER, READERS SHOULD BE AWARE THAT WEBSITES LISTED IN THIS WORK MAY HAVE CHANGED OR DISAPPEARED BETWEEN WHEN THIS WORK WAS WRITTEN AND WHEN IT IS READ. NEITHER THE PUBLISHER NOR AUTHORS SHALL BE LIABLE FOR ANY LOSS OF PROFIT OR ANY OTHER COMMERCIAL DAMAGES, INCLUDING BUT NOT LIMITED TO SPECIAL, INCIDENTAL, CONSEQUENTIAL, OR OTHER DAMAGES.
For general information on our other products and services, please contact our Customer Care Department within the U.S. at 877-762-2974, outside the U.S. at 317-572-3993, or fax 317-572-4002. For technical support, please visit https://hub.wiley.com/community/support/dummies .
Wiley publishes in a variety of print and electronic formats and by print-on-demand. Some material included with standard print versions of this book may not be included in e-books or in print-on-demand. If this book refers to media such as a CD or DVD that is not included in the version you purchased, you may download this material at http://booksupport.wiley.com . For more information about Wiley products, visit www.wiley.com .
Library of Congress Control Number: 2022931501
ISBN 978-1-119-84439-6 (pbk); ISBN 978-1-119-84440-2 (ebk); ISBN 978-1-119-84441-9 (ebk)
Microsoft® Excel® Dashboards & Reports For Dummies®
To view this book's Cheat Sheet, simply go to www.dummies.comand search for “Excel Dashboards Reports For Dummies Cheat Sheet” in the Search box.
Table of Contents
1 Cover
2 Title Page
3 Copyright
4 Introduction About This Book Foolish Assumptions Icons Used in This Book Beyond the Book Where to Go from Here
5 Part 1: Getting Started with Excel Dashboards and Reports Chapter 1: Getting in the Dashboard State of Mind Defining Dashboards and Reports Preparing for Greatness A Quick Look at Dashboard Design Principles Chapter 2: Building a Super Model Data Modeling Best Practices Excel Functions That Really Deliver Using Smart Tables That Expand with Data Introducing Dynamic Arrays Exploring Dynamic Array Functions Chapter 3: The Pivotal Pivot Table An Introduction to the Pivot Table The Four Areas of a Pivot Table Creating Your First Pivot Table Customizing Pivot Table Reports Creating Useful Pivot-Driven Views Chapter 4: Using External Data for Your Dashboards and Reports Leveraging Power Query to Extract and Transform Data Importing Data from Files Importing Data from Database Systems
6 Part 2: Building Basic Dashboard Components Chapter 5: Dressing Up Your Data Tables Table Design Principles Getting Fancy with Custom Number Formatting Chapter 6: Sparking Inspiration with Sparklines Introducing Sparklines Understanding Sparklines Customizing Sparklines Chapter 7: Formatting Your Way to Visualizations Enhancing Reports with Conditional Formatting Using Symbols to Enhance Reporting Wielding the Magical Camera Tool Enhancing Excel Reports with Shapes
7 Part 3: Adding Charts to Your Dashboards Chapter 8: Charts That Show Trending Trending Dos and Don’ts Comparative Trending Emphasizing Periods of Time Other Trending Techniques Chapter 9: Grouping and Bucketing Data Creating Top and Bottom Displays Top Values in Charts Using Histograms to Track Relationships and Frequency Chapter 10: Displaying Performance against a Target Showing Performance with Variances Showing Performance against Organizational Trends Using a Thermometer-Style Chart Using a Bullet Graph Showing Performance against a Target Range
8 Part 4: Advanced Reporting Techniques Chapter 11: Giving Users an Interactive Interface Introducing Macros Getting Started with Form Controls Using the Button Control Using the Check Box Control Using the Option Button Control Using the Combo Box Control Using the List Box Control Chapter 12: Adding Interactivity with Pivot Slicers Understanding Slicers Creating a Standard Slicer Getting Fancy with Slicer Customizations Controlling Multiple Pivot Tables with One Slicer Creating a Timeline Slicer Using Slicers as Form Controls Using Slicers on Excel Table Objects Chapter 13: Sharing Your Workbook with the Outside World Protecting Your Dashboards and Reports Linking Your Excel Dashboards to PowerPoint Distributing Your Dashboards via a PDF Distributing Your Dashboards to OneDrive Limitations When Publishing to the Web
9 Part 5: The Part of Tens Chapter 14: Ten Chart Design Principles Avoid Fancy Formatting Skip the Unnecessary Chart Junk Format Large Numbers Where Possible Use Data Tables Instead of Data Labels Make Effective Use of Chart Titles Sort Your Data before Charting Limit the Use of Pie Charts Don’t Be Afraid to Parse Data into Separate Charts Maintain Appropriate Aspect Ratios Don’t Be Afraid to Use Something Other Than a Chart Chapter 15: Ten Questions to Ask Before Distributing Your Dashboard Does My Dashboard Present the Right Information? Does Everything on My Dashboard Have a Purpose? Does My Dashboard Prominently Display the Key Message? Can I Maintain This Dashboard? Does My Dashboard Clearly Display Its Scope and Shelf Life? Is My Dashboard Well Documented? Is My Dashboard Overwhelmed with Formatting and Graphics? Does My Dashboard Overuse Charts When Tables Will Do? Is My Dashboard User-Friendly? Is My Dashboard Accurate?
Читать дальшеИнтервал:
Закладка:
Похожие книги на «Excel Dashboards & Reports For Dummies»
Представляем Вашему вниманию похожие книги на «Excel Dashboards & Reports For Dummies» списком для выбора. Мы отобрали схожую по названию и смыслу литературу в надежде предоставить читателям больше вариантов отыскать новые, интересные, ещё непрочитанные произведения.
Обсуждение, отзывы о книге «Excel Dashboards & Reports For Dummies» и просто собственные мнения читателей. Оставьте ваши комментарии, напишите, что Вы думаете о произведении, его смысле или главных героях. Укажите что конкретно понравилось, а что нет, и почему Вы так считаете.


