Joseph Schmuller - Statistical Analysis with Excel For Dummies
Здесь есть возможность читать онлайн «Joseph Schmuller - Statistical Analysis with Excel For Dummies» — ознакомительный отрывок электронной книги совершенно бесплатно, а после прочтения отрывка купить полную версию. В некоторых случаях можно слушать аудио, скачать через торрент в формате fb2 и присутствует краткое содержание. Жанр: unrecognised, на английском языке. Описание произведения, (предисловие) а так же отзывы посетителей доступны на портале библиотеки ЛибКат.
- Название:Statistical Analysis with Excel For Dummies
- Автор:
- Жанр:
- Год:неизвестен
- ISBN:нет данных
- Рейтинг книги:4 / 5. Голосов: 1
-
Избранное:Добавить в избранное
- Отзывы:
-
Ваша оценка:
Statistical Analysis with Excel For Dummies: краткое содержание, описание и аннотация
Предлагаем к чтению аннотацию, описание, краткое содержание или предисловие (зависит от того, что написал сам автор книги «Statistical Analysis with Excel For Dummies»). Если вы не нашли необходимую информацию о книге — напишите в комментариях, мы постараемся отыскать её.
fully updated for the 2021 version of Excel, you’ll hit the ground running with straightforward techniques and practical guidance to unlock the power of statistics in Excel.
Bypass unnecessary jargon and skip right to mastering formulas, functions, charts, probabilities, distributions, and correlations. Written for professionals and students without a background in statistics or math, you’ll learn to create, interpret, and translate statistics—and have fun doing it!
In this book you’ll find out how to:
Understand, describe, and summarize any kind of data, from sports stats to sales figures Confidently draw conclusions from your analyses, make accurate predictions, and calculate correlations Model the probabilities of future outcomes based on past data Perform statistical analysis on any platform: Windows, Mac, or iPad Access additional resources and practice templates through Dummies.com For anyone who’s ever wanted to unleash the full potential of statistical analysis in Excel—and impress your colleagues or classmates along the way—
walks you through the foundational concepts of analyzing statistics and the step-by-step methods you use to apply them.
Statistical Analysis with Excel For Dummies — читать онлайн ознакомительный отрывок
Ниже представлен текст книги, разбитый по страницам. Система сохранения места последней прочитанной страницы, позволяет с удобством читать онлайн бесплатно книгу «Statistical Analysis with Excel For Dummies», без необходимости каждый раз заново искать на чём Вы остановились. Поставьте закладку, и сможете в любой момент перейти на страницу, на которой закончили чтение.
Интервал:
Закладка:
7 Tap Confirm.After a few seconds, the image of the table appears in the upper half of the screen; and the data as it will appear in Excel, in the lower half. Figure 2-33 shows the inaccuracy of the OCR with respect to decimals. You can tap the X in the upper left corner to discard the picture and start again, if you like. FIGURE 2-33:An intermediate result of Data from Picture: The image of the data and the data as it will appear in Excel.
8 When you’re satisfied with the data table, tap Insert.If the accuracy isn’t perfect (and it rarely is), two buttons appear — one labeled Open Anyway and one labeled Review. Review is more of a hassle than it’s worth — it’s easier to review and make corrections after the numbers are in the spreadsheet. (See Step 9.) My rule of thumb: If the cells are properly aligned and most of the data looks okay, tap Open Anyway to put the data in the spreadsheet. If not, tap the X in the upper left corner and restart the procedure.
9 Compare the data in the spreadsheet with the data on the printed page. Correct as necessary.Do not omit this step. I pay close attention to decimals because the OCR sometimes misses the decimal point. As I point out in Step 5, recalculating statistics is a helpful check of the OCR accuracy.
In the Mac version of Data from Picture, you take the picture with an iPhone configured to use Continuity Camera; the option is called Picture from Clipboard. The Mac also gives you the option to choose a picture from your files.
Part 2
Describing Data
IN THIS PART …
Summarize and describe data
Work with Excel graphics
Determine central tendency and variability
Work with standard scores
Understand and visualize normal distributions
Chapter 3
Show-and-Tell: Graphing Data
IN THIS CHAPTER
 Introducing graphs
Working with Excel’s graphics capabilities
Adding Sparklines
The visual presentation of data is extremely important in statistics. Visual presentation enables you to discern relationships and trends you might not see if you look only at numbers. Visual presentation helps in another way: It’s valuable for presenting ideas to groups and making them understand your point of view.
Graphs come in many varieties. In this chapter, I explore the types of graphs you use in statistics and explain when it’s advisable to use them. I also show you how to use Excel to create those graphs.
Why Use Graphs?
Suppose you have to make a pitch to a Congressional committee about commercial space revenues in the early 1990s.
Which would you rather present: the data in Table 3-1or the graph in Figure 3-1, which shows the same data? (The data, by the way, is from the US Department of Commerce, via the Statistical Abstract of the US .)
TABLE 3-1US Commercial Space Revenues 1990–1994 (in Millions of Dollars)
| Industry | 1990 | 1991 | 1992 | 1993 | 1994 |
|---|---|---|---|---|---|
| Commercial Satellites Delivered | 1,000 | 1,300 | 1,300 | 1,100 | 1,400 |
| Satellite Services | 800 | 1,200 | 1,500 | 1,850 | 2,330 |
| Satellite Ground Equipment | 860 | 1,300 | 1,400 | 1,600 | 1,970 |
| Commercial Launches | 570 | 380 | 450 | 465 | 580 |
| Remote Sensing Data | 155 | 190 | 210 | 250 | 300 |
| Commercial R&D Infrastructure | 0 | 0 | 0 | 30 | 60 |
| Total | 3,385 | 4,370 | 4,860 | 5,295 | 6,640 |
Data from U.S. Department of Commerce
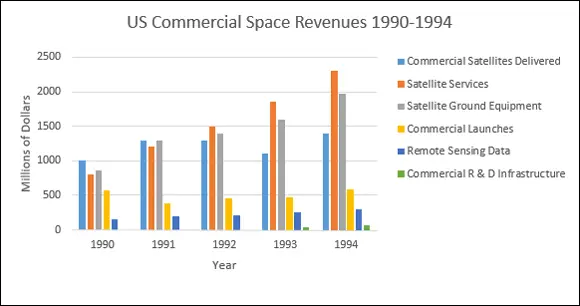
FIGURE 3-1:Graphing the data in Table 3-1.
Which one would have a greater and more lasting impact? Although the table is certainly informative, most people would argue that the graph gets the point across better and more memorably. (Eyes that glaze over when looking at numbers often shine brighter when looking at pictures.)
The graph shows you trends you might not see as quickly on the table. (Satellite services rose fastest. Commercial launches, not so much.) Bottom line: Tables are good; graphs are better.
Graphs help bring concepts to life that might otherwise be difficult to understand. In fact, I do that throughout the book. I illustrate points by, well, illustrating points!
Examining Some Fundamentals
First of all, Excel uses the word chart instead of graph. Like the graph, er, chart in Figure 3-1, most chart formats have a horizontal axis and a vertical axis. Several other formats (pie, treemap, and sunburst), which I show you later in this chapter, do not. Neither the radar chart nor the box-and-whisker chart (which also appear in this chapter) has a horizontal axis.
By convention, the horizontal axis is also called the x-axis, and the vertical axis is also called the y-axis.
Also, by convention, what goes on the horizontal axis is called the independent variable, and what goes on the vertical axis is called the dependent variable. One of Excel’s chart formats reverses that convention, and I bring that to your attention when I cover it. Just to give you a heads-up, Excel calls that reversed-axis format a bar chart. You might have seen the chart shown in Figure 3-1 referred to as a bar chart. So have I. (Actually, I’ve seen it referred to as a bar graph, but never mind that.) Excel calls Figure 3-1 a column chart, so I say columns from now on.
Getting back to independent and dependent, these terms imply that changes in the vertical direction depend (at least partly) on changes in the horizontal direction.
Another fundamental principle of creating a chart: Don’t wear out the viewer’s eyes! If you put too much into a chart in the way of information or special effects, you defeat the whole purpose of the chart.
For example, in Figure 3-1, I had to make some choices about filling in the columns. Color coded columns would have been helpful, but the page you’re looking at shows only black, white, and shades of gray.
A lot of chart creation skill comes with experience, and you just have to use your judgment. In this case, my judgment came into play with the horizontal gridlines. In most charts, I prefer not to have them. Here, they seem to add structure and help the viewer figure out the dollar value associated with each column. But then again, that’s just my opinion.
Gauging Excel's Graphics (Chartics?) Capabilities
As I mention in the preceding section, the chart in Figure 3-1 is a column chart. It’s one of many types of charts you can create with Excel. Of all the graphics possibilities Excel provides, however, only a few are useful for statistical work. Those are the ones I cover in this chapter.
In addition to the column chart, I show you how to create pie charts, bar charts, line charts, and scatterplots.
Читать дальшеИнтервал:
Закладка:
Похожие книги на «Statistical Analysis with Excel For Dummies»
Представляем Вашему вниманию похожие книги на «Statistical Analysis with Excel For Dummies» списком для выбора. Мы отобрали схожую по названию и смыслу литературу в надежде предоставить читателям больше вариантов отыскать новые, интересные, ещё непрочитанные произведения.


Обсуждение, отзывы о книге «Statistical Analysis with Excel For Dummies» и просто собственные мнения читателей. Оставьте ваши комментарии, напишите, что Вы думаете о произведении, его смысле или главных героях. Укажите что конкретно понравилось, а что нет, и почему Вы так считаете.