Joseph Schmuller - Statistical Analysis with Excel For Dummies
Здесь есть возможность читать онлайн «Joseph Schmuller - Statistical Analysis with Excel For Dummies» — ознакомительный отрывок электронной книги совершенно бесплатно, а после прочтения отрывка купить полную версию. В некоторых случаях можно слушать аудио, скачать через торрент в формате fb2 и присутствует краткое содержание. Жанр: unrecognised, на английском языке. Описание произведения, (предисловие) а так же отзывы посетителей доступны на портале библиотеки ЛибКат.
- Название:Statistical Analysis with Excel For Dummies
- Автор:
- Жанр:
- Год:неизвестен
- ISBN:нет данных
- Рейтинг книги:4 / 5. Голосов: 1
-
Избранное:Добавить в избранное
- Отзывы:
-
Ваша оценка:
Statistical Analysis with Excel For Dummies: краткое содержание, описание и аннотация
Предлагаем к чтению аннотацию, описание, краткое содержание или предисловие (зависит от того, что написал сам автор книги «Statistical Analysis with Excel For Dummies»). Если вы не нашли необходимую информацию о книге — напишите в комментариях, мы постараемся отыскать её.
fully updated for the 2021 version of Excel, you’ll hit the ground running with straightforward techniques and practical guidance to unlock the power of statistics in Excel.
Bypass unnecessary jargon and skip right to mastering formulas, functions, charts, probabilities, distributions, and correlations. Written for professionals and students without a background in statistics or math, you’ll learn to create, interpret, and translate statistics—and have fun doing it!
In this book you’ll find out how to:
Understand, describe, and summarize any kind of data, from sports stats to sales figures Confidently draw conclusions from your analyses, make accurate predictions, and calculate correlations Model the probabilities of future outcomes based on past data Perform statistical analysis on any platform: Windows, Mac, or iPad Access additional resources and practice templates through Dummies.com For anyone who’s ever wanted to unleash the full potential of statistical analysis in Excel—and impress your colleagues or classmates along the way—
walks you through the foundational concepts of analyzing statistics and the step-by-step methods you use to apply them.
Statistical Analysis with Excel For Dummies — читать онлайн ознакомительный отрывок
Ниже представлен текст книги, разбитый по страницам. Система сохранения места последней прочитанной страницы, позволяет с удобством читать онлайн бесплатно книгу «Statistical Analysis with Excel For Dummies», без необходимости каждый раз заново искать на чём Вы остановились. Поставьте закладку, и сможете в любой момент перейти на страницу, на которой закончили чтение.
Интервал:
Закладка:
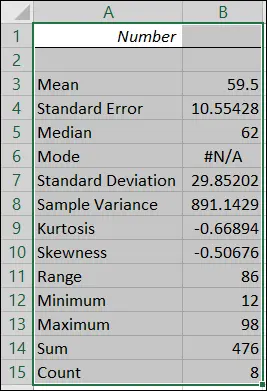
FIGURE 2-28:The output of the Descriptive Statistics tool.
Additional data analysis tool packages
Two other data analysis tool packages are available for Excel. The good news is that both work on Windows, Mac, and iPad.
One is called the XLMiner Analysis ToolPak (from Frontline Systems) and it does everything the original Toolpak does, plus an analysis called Logistic Regression . Rather than take you through this package in every chapter, I leave it until Chapter 21when I cover Logistic Regression — and the XLMiner Analysis ToolPak provides the best way to get the job done.
I use the iPad as an opportunity to explore the other package, StatPlus (from AnalystSoft). This way, you get a deep dive into another toolset, and I don’t have to cover every combination of every platform (Windows, Mac, iPad) with every tool package (Analysis Toolpak, XLMiner ToolPak, StatPlus) in every chapter!
It turns out that the free version of StatPlus — the one I work with in this book — has some of the tools the Toolpak provides and also has some goodies the Toolpak lacks. That makes it very much worth having. Luckily for you, this add-in is easy to set up and to work with. All you have to do to add it to Excel on your iPad is tap Insert | Add-Ins | See All. In the Office Add-Ins box that appears, scroll down to StatPlus and tap Add.
When you want to use a StatPlus tool on the iPad, follow these steps:
1 Enter your data into an array.It’s a good idea to name the tab of the worksheet that contains the array.
2 Tap Insert | Add-ins | StatPlus to open the Add-ins box.If you’ve used StatPlus recently, its icon appears immediately under Recently Used Add-ins. If it doesn’t, find it in My Add-Ins. Tapping StatPlus opens the StatPlus pane on the right side of the screen.
3 In the StatPlus panel, tap New Analysis to open the Commands box.
4 Hunt down the analysis tool you want.The Commands box is organized into categories, so you might have to tap a couple of categories before you find the tool you’re looking for.
5 Tap the name of the tool.
6 Enter the values into the boxes on the StatPlus panel.From the drop-down menu for the Columns For box, select the tab where your data lives. If your spreadsheet is open to that tab, its name already appears in the Columns For box.In the Headers box, you can choose either Name in the first row or no headers.For the next few steps, keep in mind that the tool you use determines the number of Variables boxes you work with.
7 To add an array to a Variables box, select it on the spreadsheet and then tap the little three-cells-and-a-plus-sign icon for the appropriate Variables box.This step opens the Variables pane.
8 Tap Add in that pane to return to the previous pane.The selected range is in the Variables box.
9 Tap Run.StatPlus opens a new worksheet with the results.
Figure 2-29 shows the StatPlus pane after Steps 1–5 for the descriptive statistics example in the preceding section.
Figure 2-30 shows the results of the analysis. Notice that the title at the top shows the mean plus-or-minus the standard deviation.
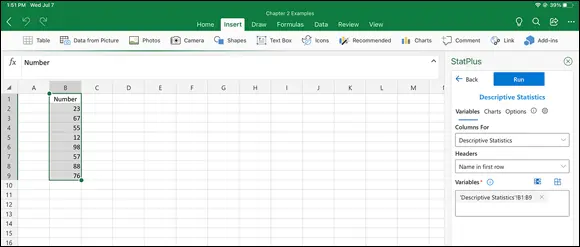
FIGURE 2-29:The StatPlus pane, with entered values for a Descriptive Statistics analysis.
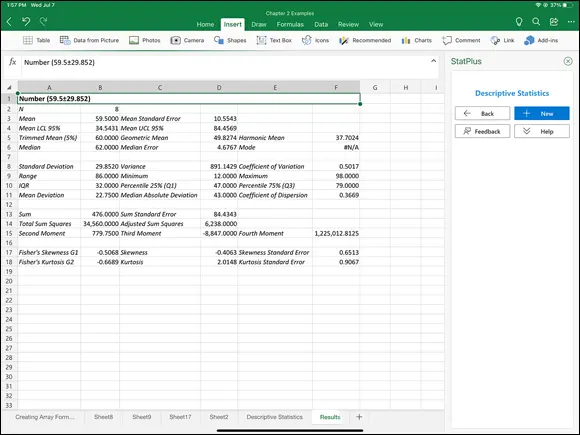
FIGURE 2-30:The results of the Descriptive Statistics analysis — compare with the results shown in Figure 2-28.
Accessing Commonly Used Functions
Need quick access to a few commonly used statistical functions? You can get to AVERAGE, MIN(minimum value in a selected cell range) and MAX(maximum value in a selected range) by clicking the down arrow next to the AutoSum button on the left side of the Formulas tab. Clicking this down arrow also gets you to the Mathematical functions SUMand COUNT NUMBERS(counts the numerical values in a cell range).
The AutoSum button is labeled ∑. Figure 2-31 shows you not only exactly where it is but also the menu opened by its down arrow. For some reason, it's in the Editing area of the Home tab. Another AutoSum button (with the same menu) is in the Function library of the Formulas tab.
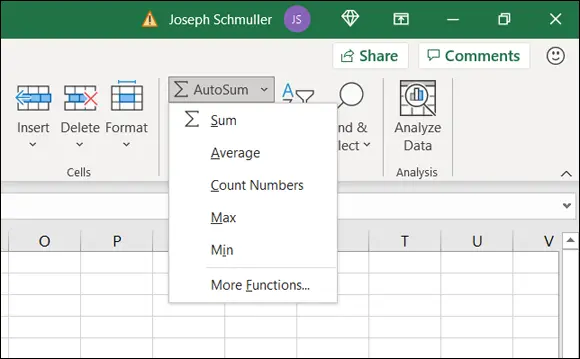
FIGURE 2-31:The Home ∑ button and the menu that clicking its down arrow opens.
By the way, if you just click the ∑ button and not the down arrow, you get SUM.
The last selection on that menu is yet another way to open the Insert Function dialog box.
 One nice thing about using the ∑ menu: It eliminates a step. When you select a function, you don’t have to select a cell for the result — just select the cell range, and the function inserts the value in a cell immediately after the range.
The New Analyze Data Tool
The Analyze Data tool is a new feature for Windows and Mac. In your worksheet, select cells with data and then choose Home | Analyze Data to open the Analyze Data pane. Figure 2-32 shows the pane after I selected the data in an example from Chapter 1. (I removed the totals and proportions, although that’s not necessary.)
The pane offers a number of suggestions, including charts (Excel’s name for graphs) to visualize the data as well as a possible correlation between data in two of the columns (the years 1990 and 2001). I have more to say about charts in Chapter 3. (Correlation? What’s that? Chapter 15tells you all about it.)
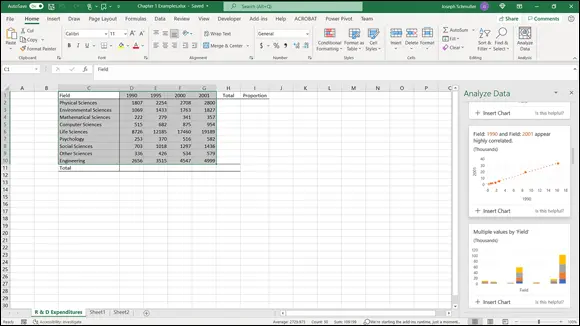
FIGURE 2-32:The Analyze Data tool at work.
Data from Pictures!
This new feature is for non-Windows only. (About time, eh?) Here, I describe the iPad version. You use the iPad camera to take a picture of a data table that appears on a printed page and then, through the magic of OCR (optical character recognition), Excel extracts the data in the picture and puts it into a spreadsheet.
To start collecting data, follow these steps on your iPad:
1 Find a printed page that presents a data table.For this exercise, I use Table 14-2 of this book.
2 Flatten out the page as much as possible.This increases the OCR’s accuracy.
3 Select a cell in the spreadsheet where you want the data table to begin.
4 Choose Insert | Data from Picture to activate the iPad camera.
5 Take a picture of the data table. Important advice: I hold the iPad in Portrait mode so that the white button is at the bottom of the screen. If I hold it in Landscape mode (which is probably the way you hold your iPad when you use it for Excel), I end up with gobbledygook. Trust me on this one.
6 Adjust the white rectangle to crop out everything but the data.This table has some statistics calculated in the bottom rows. In this example, I crop out those rows and then recalculate the statistics after the data are in the spreadsheet. It’s a helpful check on the accuracy of the OCR — if the recalculated statistics don’t match up with the printed version, something is obviously amiss.
Читать дальшеИнтервал:
Закладка:
Похожие книги на «Statistical Analysis with Excel For Dummies»
Представляем Вашему вниманию похожие книги на «Statistical Analysis with Excel For Dummies» списком для выбора. Мы отобрали схожую по названию и смыслу литературу в надежде предоставить читателям больше вариантов отыскать новые, интересные, ещё непрочитанные произведения.


Обсуждение, отзывы о книге «Statistical Analysis with Excel For Dummies» и просто собственные мнения читателей. Оставьте ваши комментарии, напишите, что Вы думаете о произведении, его смысле или главных героях. Укажите что конкретно понравилось, а что нет, и почему Вы так считаете.