Savo G. Glisic - Artificial Intelligence and Quantum Computing for Advanced Wireless Networks
Здесь есть возможность читать онлайн «Savo G. Glisic - Artificial Intelligence and Quantum Computing for Advanced Wireless Networks» — ознакомительный отрывок электронной книги совершенно бесплатно, а после прочтения отрывка купить полную версию. В некоторых случаях можно слушать аудио, скачать через торрент в формате fb2 и присутствует краткое содержание. Жанр: unrecognised, на английском языке. Описание произведения, (предисловие) а так же отзывы посетителей доступны на портале библиотеки ЛибКат.

- Название:Artificial Intelligence and Quantum Computing for Advanced Wireless Networks
- Автор:
- Жанр:
- Год:неизвестен
- ISBN:нет данных
- Рейтинг книги:3 / 5. Голосов: 1
-
Избранное:Добавить в избранное
- Отзывы:
-
Ваша оценка:
Artificial Intelligence and Quantum Computing for Advanced Wireless Networks: краткое содержание, описание и аннотация
Предлагаем к чтению аннотацию, описание, краткое содержание или предисловие (зависит от того, что написал сам автор книги «Artificial Intelligence and Quantum Computing for Advanced Wireless Networks»). Если вы не нашли необходимую информацию о книге — напишите в комментариях, мы постараемся отыскать её.
A practical overview of the implementation of artificial intelligence and quantum computing technology in large-scale communication networks Artificial Intelligence and Quantum Computing for Advanced Wireless Networks
Artificial Intelligence and Quantum Computing for Advanced Wireless Networks
Artificial Intelligence and Quantum Computing for Advanced Wireless Networks — читать онлайн ознакомительный отрывок
Ниже представлен текст книги, разбитый по страницам. Система сохранения места последней прочитанной страницы, позволяет с удобством читать онлайн бесплатно книгу «Artificial Intelligence and Quantum Computing for Advanced Wireless Networks», без необходимости каждый раз заново искать на чём Вы остановились. Поставьте закладку, и сможете в любой момент перейти на страницу, на которой закончили чтение.
Интервал:
Закладка:
In Figure 2.15, we have shown a graphical representation of a PCA transformation in only two dimensions (x ∈ ℝ 2) with a slightly different notation ( χ represented by z ). As can be seen from Figure 2.15, the variance of the data in the original data space is best captured in the rotated space given by vectors = W tx. χ 1is the first principal component, and it goes in the direction of most variance; χ 2is the second principal component, and is orthogonal to the first direction and goes in the second direction with the most variance (in ℝ 2there is not much choice, but in the general case, ℝ M, there is). Observe that without loss of generality the data is centered about the origin of the output space. We can rewrite the objective function as

Note that the class membership matrix ( U in vector quantization) has been substituted in this case by W t X , which in general can take any positive or negative value. It, thus, has lost its membership meaning and simply constitutes the weights of the linear combination of the column vectors of W that better approximate each input x. Finally, the PCA objective function can also be written as
J PCA= Tr{ W t ∑ X W } [44], where  is the covariance matrix of the observed data. The PCA formulation has also been extended to complex‐valued input vectors [45]; the method is called non‐circular PCA .
The matrix projection of the input vectors onto a lower‐dimensional space ( χ= W tx) is a widespread technique in dimensionality reduction. As an illustration, let us look at the following example [46]:
Design Example 2.5
Assume that we are analyzing scientific articles related to a specific domain. Each article will be represented by a vector x of word frequencies; that is, we choose a set of M words representative of our scientific area, and we annotate how many times each word appears in each article. Each vector x is then orthogonally projected onto the new subspace defined by the vectors w i. Each vector w ihas dimension M , and it can be understood as a “topic” (i.e. a topic is characterized by the relative frequencies of the M different words; two different topics will differ in the relative frequencies of the M words). The projection of x onto each w igives an idea of how important topic w iis for representing the article. Important topics have large projection values and, therefore, large values in the corresponding component of χ .
It can be shown [43, 47], as already indicated in Section 2.1, that when the input vectors, x , are zero‐mean (if they are not, we can transform the input data simply by subtracting the sample average vector), then the solution of the minimization of J PCAis given by the m eigenvectors associated to the largest m eigenvalues of the covariance matrix of x {  , note that the covariance matrix of x is a M × M matrix with M eigenvalues). If the eigenvalue decomposition of the input covariance matrix is
  (since C xis a real‐symmetric matrix), then the feature vectors are constructed as
  , where Λ mis a diagonal matrix with the m largest eigenvalues of the matrix Λ Mand W mare the corresponding m columns from the eigenvectors matrix W M. We could have constructed all the feature vectors at the same time by projecting the whole matrix X ,
  . Note that the i ‐th feature is the projection of the input vector x onto the i ‐th eigenvector,
  . The computed feature vectors have an identity covariance matrix, C χ= I , meaning that the different features are decorrelated.
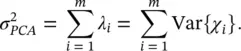
Univariate variance is a second‐order statistical measure of the departure of the input observations with respect to the sample mean. A generalization of the univariate variance to multivariate variables is the trace of the input covariance matrix. By choosing the m largest eigenvalues of the covariance matrix C x, we guarantee that we are making a representation in the feature space explaining as much variance of the input space as possible with only m variables. As already indicated in Section 2.1, in fact, w 1is the direction in which the data exhibit the largest variability, w 2is the direction with largest variability once the variability along w 1has been removed, w 3is the direction with largest variability once the variability along w 1and w 2has been removed, and so on. Thanks to the orthogonality of the w ivectors, and the subsequent decorrelation of the feature vectors, the total variance explained by PCA decomposition can be conveniently measured as the sum of the variances of each feature,
References
1 1 Robert Nau, Statistical forecasting: notes on regression and time series analysis, https://people.duke.edu/~rnau/regintro.htm (accessed 12 May 2021).
2 2 https://www.analyticsvidhya.com/blog/2016/01/xgboost‐algorithm‐easy‐steps
3 3 PulkitS01. K‐Means implementation. GitHub, Inc. https://gist.github.com/PulkitS01/97c9920b1c913ba5e7e101d0e9030b0e
4 4 https://pdfslide.net/documents/chapter‐321‐logistic‐regression‐ncss‐321‐logistic‐regression‐introduction‐.html
5 5 https://iq.opengenus.org/newton‐raphson‐method
6 6 https://www.math.ubc.ca/~anstee/math104/newtonmethod.pdf
7 7 http://mathforcollege.com/nm/mws/gen/03nle/mws_gen_nle_txt_newton.pdf
8 8 Rokach, L. and Maimon, O. (2005). Top‐down induction of decision trees classifiers – a survey. IEEE Trans. Syst., Man, Cybernet. – Part C: Appl. Rev. 35 (4): 476–487.
9 9 Safavin, S.R. and Landgrebe, D. (1991). A survey of decision tree classifier methodology. IEEE Trans. Syst. Man Cybern. 21 (3): 660–674.
10 10 Murthy, S.K. (1998). Automatic construction of decision trees from data: a multidisciplinary survey. Data Min. Knowl. Discovery 2 (4): 345–389.
Читать дальшеИнтервал:
Закладка:
Похожие книги на «Artificial Intelligence and Quantum Computing for Advanced Wireless Networks»
Представляем Вашему вниманию похожие книги на «Artificial Intelligence and Quantum Computing for Advanced Wireless Networks» списком для выбора. Мы отобрали схожую по названию и смыслу литературу в надежде предоставить читателям больше вариантов отыскать новые, интересные, ещё непрочитанные произведения.


Обсуждение, отзывы о книге «Artificial Intelligence and Quantum Computing for Advanced Wireless Networks» и просто собственные мнения читателей. Оставьте ваши комментарии, напишите, что Вы думаете о произведении, его смысле или главных героях. Укажите что конкретно понравилось, а что нет, и почему Вы так считаете.