Richard J. Rossi - Applied Biostatistics for the Health Sciences
Здесь есть возможность читать онлайн «Richard J. Rossi - Applied Biostatistics for the Health Sciences» — ознакомительный отрывок электронной книги совершенно бесплатно, а после прочтения отрывка купить полную версию. В некоторых случаях можно слушать аудио, скачать через торрент в формате fb2 и присутствует краткое содержание. Жанр: unrecognised, на английском языке. Описание произведения, (предисловие) а так же отзывы посетителей доступны на портале библиотеки ЛибКат.

- Название:Applied Biostatistics for the Health Sciences
- Автор:
- Жанр:
- Год:неизвестен
- ISBN:нет данных
- Рейтинг книги:3 / 5. Голосов: 1
-
Избранное:Добавить в избранное
- Отзывы:
-
Ваша оценка:
Applied Biostatistics for the Health Sciences: краткое содержание, описание и аннотация
Предлагаем к чтению аннотацию, описание, краткое содержание или предисловие (зависит от того, что написал сам автор книги «Applied Biostatistics for the Health Sciences»). Если вы не нашли необходимую информацию о книге — напишите в комментариях, мы постараемся отыскать её.
APPLIED BIOSTATISTICS FOR THE HEALTH SCIENCES Applied Biostatistics for the Health Sciences
Applied Biostatistics for the Health Sciences
Applied Biostatistics for the Health Sciences — читать онлайн ознакомительный отрывок
Ниже представлен текст книги, разбитый по страницам. Система сохранения места последней прочитанной страницы, позволяет с удобством читать онлайн бесплатно книгу «Applied Biostatistics for the Health Sciences», без необходимости каждый раз заново искать на чём Вы остановились. Поставьте закладку, и сможете в любой момент перейти на страницу, на которой закончили чтение.
Интервал:
Закладка:
and similarly for Y
A parameter that measures the joint relationship between two quantitative variables, say X and Y , is the correlation coefficient that will be denoted by ρ . The correlation coefficient measures the linear relationship between X and Y . That is, ρ measures the overall agreement between the pairs ( X , Y ) and the line Y=aX+b. The correlation coefficient is defined as
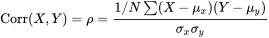
where μx, μy and σx, σy are the means and standard deviations of X and Y , respectively.
The correlation coefficient is a unitless parameter that falls between −1 and 1. That is, the correlation between X and Y does not depend on the particular scales of units the variables are measured in. For example, if X is the height of an individual in pounds and Y is the height of an individual in inches, then the value of the correlation coefficient will be the same when X is measured in kilograms and Y is measured in centimeters. Also, the correlation between X and Y is the same as the correlation between Y and X (i.e., Corr(X,Y)= Corr( Y , X )).
It is important to note that the correlation coefficient can be used only with two quantitative variables and only measures the strength of the linear relationship between X and Y . A positive value of the correlation coefficient suggests that the larger values of X are more likely to occur with the larger values of Y and the smaller values of X with the smaller values of Y . A negative correlation indicates the larger values of X are more likely to occur with the smaller values of Y and the smaller values of X with the larger values of Y . Several properties of the correlation coefficient are listed below.
1 The value of the correlation coefficient is always between −1 and 1 (i.e., −1≤ ρ≤1). When the correlation coefficient equals −1 or 1, the variables X and Y are said to be perfectly correlated. When two variables X and Y are perfectly correlated, the linear relationship is exact and Y=aX+b for some values a and b. In this case, the value of Y is determined by the value of X. Furthermore, when ρ=−1 the value of b will be negative, and when ρ = 1 the value of b will be positive.
2 When ρ≠±1, the value of Y cannot be perfectly predicted from the value of X and the relationship iswhere ε is an error term associated with the deviation from the linear relationship. The closer ρ is to ±1, the stronger the linear relationship between the variables X and Y.
3 The strength of the linear relationship between X and Y is based on the value of the correlation coefficient and is often summarized according to the following guidelines:−0.30≤ρ<0.30 indicates at most a very weak linear relationship,−0.50<���ρ≤−0.30 or 0.30≤ρ<0.50 indicates a weak linear relationship,−0.80<���ρ≤−0.50 or 0.50≤ρ<0.80 indicates a moderate linear relationship,−0.90<���ρ≤−0.80 or 0.80≤ρ<0.90 indicates a strong linear relationship,ρ≤−0.90 or ρ≥0.90 indicates a very strong linear relationship.However, any discussion of the strength of the linear relationship between two variables must take into account the standards used in the discipline in which the research is being carried out.
4 When ρ ≈ 0, there is no apparent linear relationship between the two variables. However, this does not exclude the possibility that there is a curvilinear relationship between the two variables.
In a multivariate distribution with more than two quantitative variables, the correlation coefficient can be computed for each pair of variables. For example, with three quantitative variables, say X,Y, and Z , the three correlation coefficients that can be computed are Corr(X,Y)=ρxy, Corr(X,Z)=ρxz, and Corr(Y,Z)=ρyz. In most biomedical studies, there is a well-defined response variable and a set of explanatory variables. Since the changes in the explanatory variables are believed to cause changes in the response variable, the most important correlations to consider are those between the response variable and each of the explanatory variables.
Finally, correlation should not be confused with causation. A causal relationship exists when changing the value of X directly causes a change in the value of Y or vice versa. The correlation coefficient only measures the tendency for the value of Y to increase or decrease linearly with the values of X . Thus, a high correlation between X and Y does not necessarily indicate that changes in X will cause changes in Y . For example, there is a positive correlation between the number of times an individual on a diet weighs themselves in a week and their weight loss. Clearly, the number of times an individual weighs themselves does not cause a change in their weight. Causal relationships must be supported by honest logical and scientific reasoning. With the proper use of scientific principles and well-designed experiments, high correlations can often be used as evidence supporting a causal relationship.
2.3 Probability
In a data-based biomedical study, a random sample will be selected from the target population and a well-designed sampling plan requires knowing the chance of drawing a particular observation or set of observations. For example, it might be important to know the chance of drawing a female individual or an individual between the ages of 30 and 60. In other studies, it might be important to determine the likelihood that a particular genetic trait will be passed from the parents to their offspring.
A probability is a number between 0 and 1 that measures how likely it is for an event to occur. Probabilities are associated with tasks or experiment where the outcome cannot be determined without actually carrying out the task. A task where the outcome cannot be predetermined is called a random experiment or a chance experiment . For example, prior to treatment it cannot be determined whether chemotherapy will improve a cancer patient’s health. Thus, the result of a chemotherapy treatment can be treated as a chance experiment before chemotherapy is started. Similarly, when drawing a random sample from the target population, the actual values of the sample will not be known until the sample is actually collected. Hence, drawing a random sample from the target population is a chance experiment.
Because statistical inferences are based on a sample from the population rather than a census of the population, the statistical inferences will have a degree of uncertainty associated with them. The measures of reliability for statistical inferences drawn from a sample are based on the underlying probabilities associated with the target population.
In a chance experiment, the actual outcome of the experiment cannot be predetermined, but it is important for the experimenter to identify all of the possible outcomes of the experiment before it is carried out. The set of all possible outcomes of a chance experiment is called the sample space and will be denoted by S. A subcollection of the outcomes in the sample space is called an event , and the probability of an event measures how likely the event is. An event is said to occur when a chance experiment is carried out and the chance experiment results in one of the outcomes in the event. For example, in a chance experiment consisting of randomly selecting an adult from a well-defined population, if A is the event that an individual between the ages of 30 and 60 is selected, then the event A will occur if and only if the age of the individual selected is between 30 and 60; if the age of the individual is not between 30 and 60, then the event A will not occur.
Читать дальшеИнтервал:
Закладка:
Похожие книги на «Applied Biostatistics for the Health Sciences»
Представляем Вашему вниманию похожие книги на «Applied Biostatistics for the Health Sciences» списком для выбора. Мы отобрали схожую по названию и смыслу литературу в надежде предоставить читателям больше вариантов отыскать новые, интересные, ещё непрочитанные произведения.


Обсуждение, отзывы о книге «Applied Biostatistics for the Health Sciences» и просто собственные мнения читателей. Оставьте ваши комментарии, напишите, что Вы думаете о произведении, его смысле или главных героях. Укажите что конкретно понравилось, а что нет, и почему Вы так считаете.