Bioinformatics
Здесь есть возможность читать онлайн «Bioinformatics» — ознакомительный отрывок электронной книги совершенно бесплатно, а после прочтения отрывка купить полную версию. В некоторых случаях можно слушать аудио, скачать через торрент в формате fb2 и присутствует краткое содержание. Жанр: unrecognised, на английском языке. Описание произведения, (предисловие) а так же отзывы посетителей доступны на портале библиотеки ЛибКат.
- Название:Bioinformatics
- Автор:
- Жанр:
- Год:неизвестен
- ISBN:нет данных
- Рейтинг книги:4 / 5. Голосов: 1
-
Избранное:Добавить в избранное
- Отзывы:
-
Ваша оценка:
Bioinformatics: краткое содержание, описание и аннотация
Предлагаем к чтению аннотацию, описание, краткое содержание или предисловие (зависит от того, что написал сам автор книги «Bioinformatics»). Если вы не нашли необходимую информацию о книге — напишите в комментариях, мы постараемся отыскать её.
“This book is a gem to read and use in practice.”
— "This volume has a distinctive, special value as it offers an unrivalled level of details and unique expert insights from the leading computational biologists, including the very creators of popular bioinformatics tools."
— “A valuable survey of this fascinating field. . . I found it to be the most useful book on bioinformatics that I have seen and recommend it very highly.”
— “This should be on the bookshelf of every molecular biologist.”
— The field of bioinformatics is advancing at a remarkable rate. With the development of new analytical techniques that make use of the latest advances in machine learning and data science, today’s biologists are gaining fantastic new insights into the natural world’s most complex systems. These rapidly progressing innovations can, however, be difficult to keep pace with.
The expanded fourth edition of the best-selling
aims to remedy this by providing students and professionals alike with a comprehensive survey of the current field. Revised to reflect recent advances in computational biology, it offers practical instruction on the gathering, analysis, and interpretation of data, as well as explanations of the most powerful algorithms presently used for biological discovery.
offers the most readable, up-to-date, and thorough introduction to the field for biologists at all levels, covering both key concepts that have stood the test of time and the new and important developments driving this fast-moving discipline forwards.
This new edition features:
New chapters on metabolomics, population genetics, metagenomics and microbial community analysis, and translational bioinformatics A thorough treatment of statistical methods as applied to biological data Special topic boxes and appendices highlighting experimental strategies and advanced concepts Annotated reference lists, comprehensive lists of relevant web resources, and an extensive glossary of commonly used terms in bioinformatics, genomics, and proteomics
is an indispensable companion for researchers, instructors, and students of all levels in molecular biology and computational biology, as well as investigators involved in genomics, clinical research, proteomics, and related fields.
Bioinformatics — читать онлайн ознакомительный отрывок
Ниже представлен текст книги, разбитый по страницам. Система сохранения места последней прочитанной страницы, позволяет с удобством читать онлайн бесплатно книгу «Bioinformatics», без необходимости каждый раз заново искать на чём Вы остановились. Поставьте закладку, и сможете в любой момент перейти на страницу, на которой закончили чтение.
Интервал:
Закладка:
In the Filters and Masking section, one should filter to remove low-complexity regions. Low-complexity regions are defined simply as regions of biased composition (Wootton and Federhen 1993). These may include homopolymeric runs, short-period repeats, or the subtle over-representation of several residues in a sequence. The biological role of these low-complexity regions is not understood; it is thought that they may represent the results of either DNA replication errors or unequal crossing-over events. It is important to determine whether sequences of interest contain low-complexity regions; they tend to prove problematic when performing sequence alignments and can lead to false-positive results, as they are generally similar across unrelated proteins. Finally, before issuing the query, be sure to check the box marked “Show results in a new window.” This leaves the original query window (or tab) in place, making it easier to go back and refine or change search parameters, as needed.
Understanding the BLAST Output
The first part of the BLASTP results for the query described above is shown in Figure 3.8. The top part of the figure shows the position of conserved protein domains found by comparing the query sequence with data found within NCBI's Conserved Domain Database (CDD). This is followed by a graphical overview of the BLASTP results, providing a sense of how many sequences were found to have similarity to the query and how they scored against the query. Details of the various graphical display features are given in the legend to Figure 3.8. The actual list of sequences found as a result of this particular BLASTP search – the “hit list” – is shown, in part, in Figure 3.9. The information included for each hit includes the definition line from the hit's source database entry, the score value that is, in turn, used to calculate the E value for the best HSP alignment, the percent identity for that best HSP alignment, and the hyperlinked accession number, allowing for direct access to the source database record for that hit. The table is sorted by E value from lowest to highest, by default; recall that lower values of E represent better alignments. In the E value column, notice that many of the entries have E -values of 0.0. This represents a vanishingly low E value that has been rounded down to zero and implies statistical significance. Note that each entry in the hit list is preceded by a check box; checking one or more of these boxes lights up the grayed-out options shown in Figure 3.9, allowing the user to download the selected sequences, view the selected hits graphically, generate a dendrogram, or construct a multiple sequence alignment on the fly.
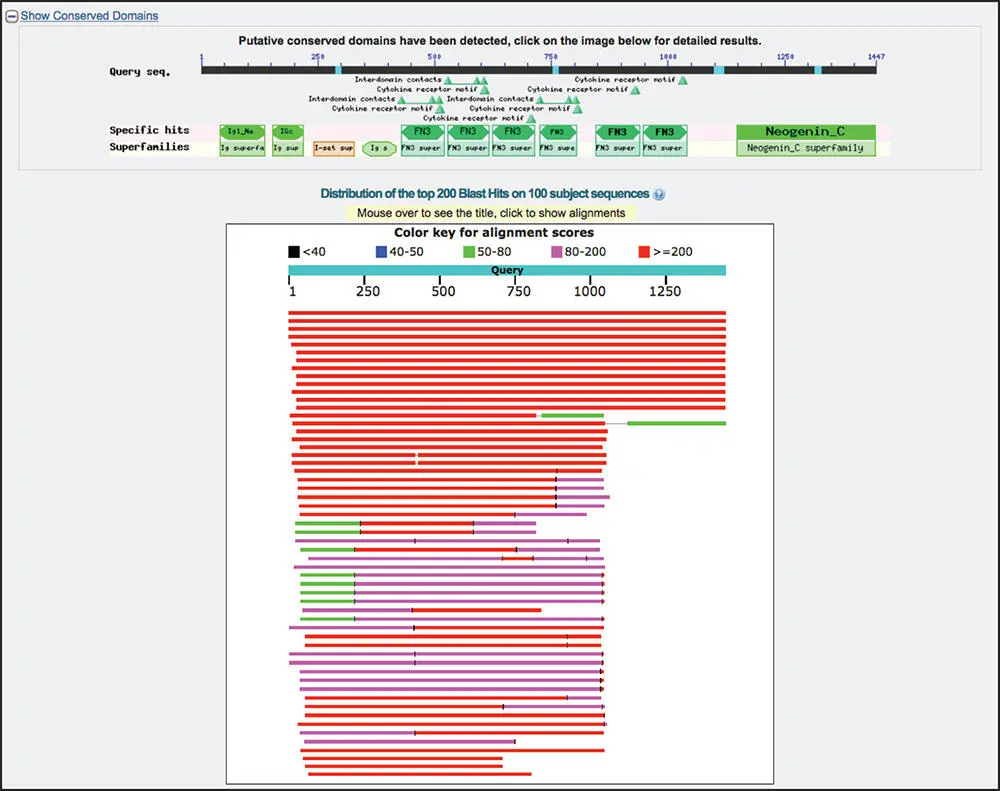
Figure 3.8 Graphical display of BLASTP results. The query sequence is represented by the thick cyan bar labeled “Query,” with the tick marks indicating residue positions within the query. The thinner bars below the query represent each of the matches (“hits”) detected by the BLAST algorithm. The colors represent the relative scores for each hit, with the color key for the scores appearing at the top of the box. The length of each line, as well as its position, represents the region of similarity with the query. Hits connected by a thin line indicate more than one high-scoring segment pair (HSP) within the same sequence; similarly, a thin vertical bar crossing one of the hits indicates a break in the overall alignment. Moving the mouse over any of the lines produces a pop-up that shows the identity of that hit. Clicking on any of the lines takes the user directly to detailed information about that hit (see Figure 3.10).
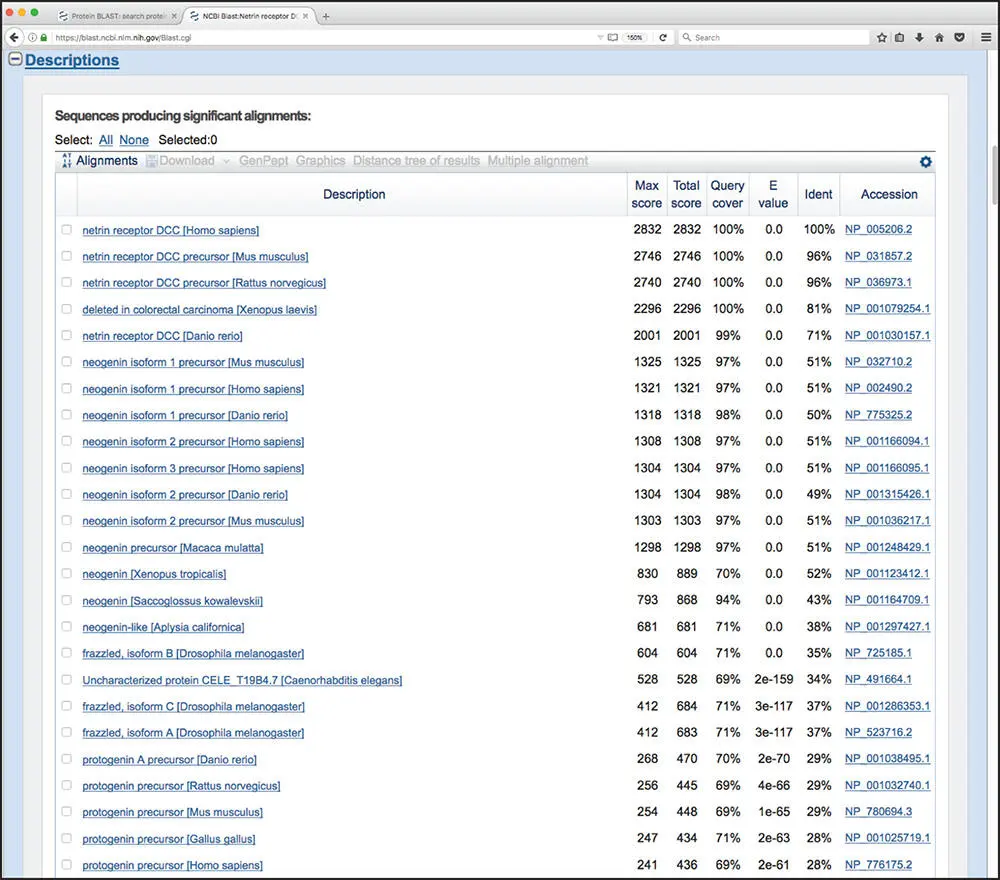
Figure 3.9 The BLASTP “hit list.” For each sequence found, the user is presented with the definition line from the hit's source database entry, the score value for the best high-scoring segment pair (HSP) alignment, the total of all scores across all HSP alignments, the percentage of the query covered by the HSPs, and the E value and percent identity for the best HSP alignment. The hyperlinked accession number allows for direct access to the source database record for that hit. In the E value column, vanishingly low E values are rounded down to zero. For non-zero E values, exponential notation is used; using the first non-zero value in the figure, 2e-159 should be read as 2 × 10 −159.
Clicking on the name of any of the proteins in the hit list moves the user down the page to the portion of the output showing the pairwise alignment(s) for that hit ( Figure 3.10). The header provides the complete definition line for this particular hit, and each identified HSP is then shown below the header. In most cases, the user will only see one alignment, but in the case shown in Figure 3.10there are two, with the hit having the better score and E value shown first. The statistics given for each hit include the E value, the number of identities (exact matches), the number of “positives” (exact matches and conservative substitutions), and the number of residues that fell into a gapped region. Within the alignments, gaps are indicated by dashes, while low-complexity regions are indicated by grayed-out lower case letters.
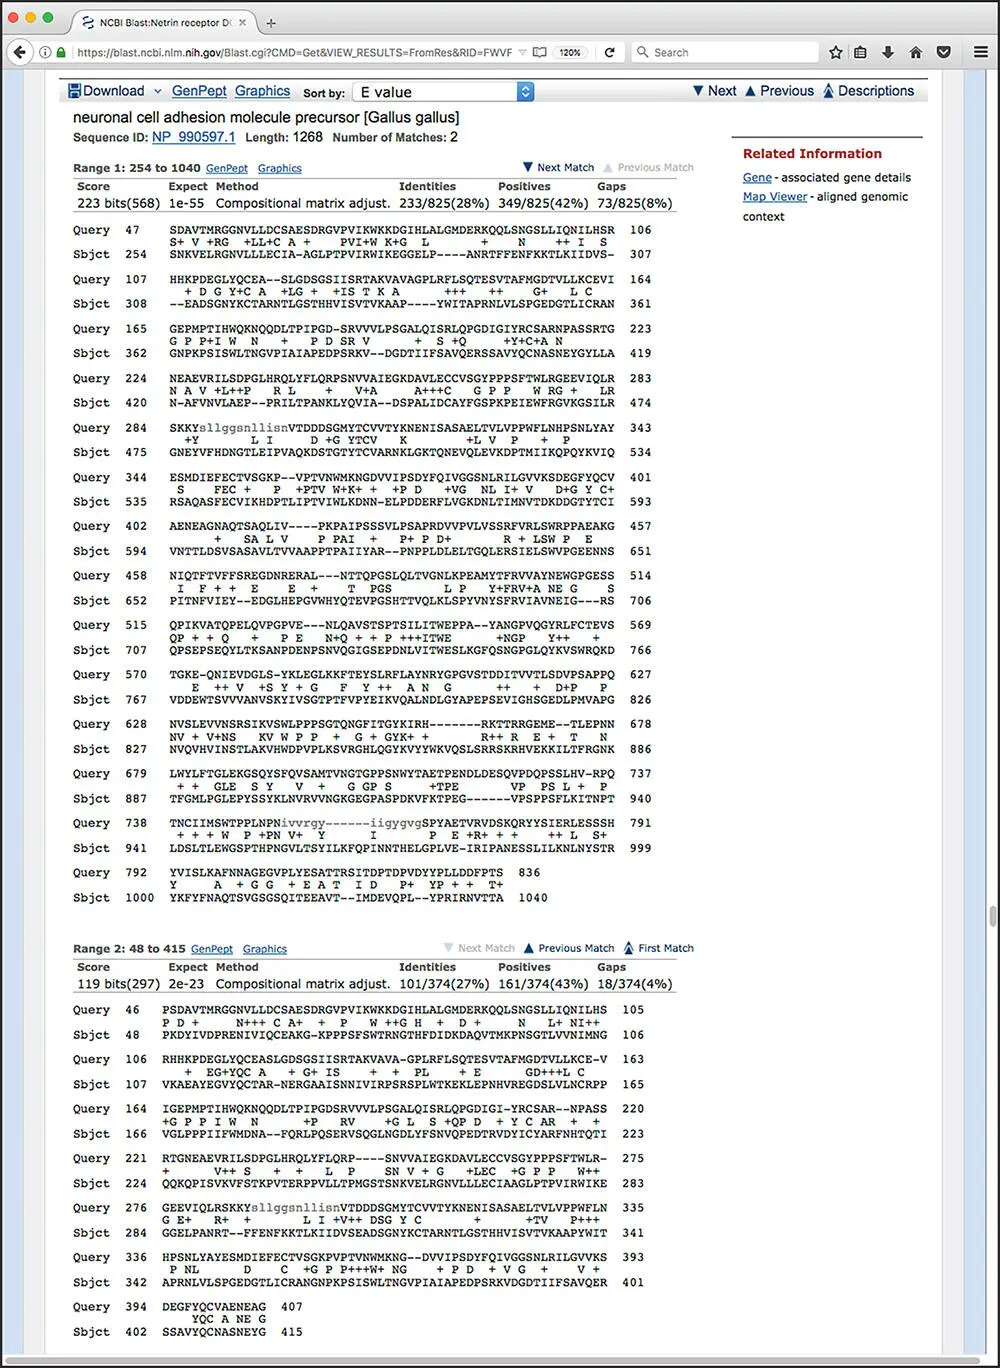
Figure 3.10 Detailed information on a representative BLASTP hit. The header provides the identity of the hit, as well as the score and E value. The percent identity indicates exact matches, whereas the percent “positives” considers both exact matches and conservative substitutions. The gap figures show how many residues remain unaligned owing to the introduction of gaps. Gaps are indicated by dashes and low-complexity regions are indicated by grayed-out lower case letters. Note that there is no header preceding the second alignment; this indicates that this is a second high-scoring segment pair (HSP) within the same database entry.
Suggested BLAST Cut-Offs
As was previously alluded to, the listing of a hit in a BLAST report does not automatically mean that the hit is biologically significant. Over time, and based on both the methodical testing and the personal experience of many investigators, many guidelines have been put forward as being appropriate for establishing a boundary that separates meaningful hits from the rest. For nucleotide-based searches, one should look for E values of 10 −6or less and sequence identities of 70% or more. For protein-based searches, one should look for hits with E values of 10 −3or less and sequence identities of 25% or more. Using less-stringent cut-offs risks entry into what is called the “twilight zone,” the low-identity region where any conclusions regarding the relationship between two sequences may be questionable at best (Doolittle 1981, 1989; Vogt et al. 1995; Rost 1999).
The reader is cautioned not to use these cut-offs (or any other set of suggested cut-offs) blindly, particularly in the region right around the dividing line. Users should always keep in mind whether the correct scoring matrix was used. Likewise, they should manually inspect the pairwise alignments and investigate the biology behind any putative homology by reading the literature to convince themselves whether hits on either side of the suggested cut-offs actually make good biological sense.
Читать дальшеИнтервал:
Закладка:
Похожие книги на «Bioinformatics»
Представляем Вашему вниманию похожие книги на «Bioinformatics» списком для выбора. Мы отобрали схожую по названию и смыслу литературу в надежде предоставить читателям больше вариантов отыскать новые, интересные, ещё непрочитанные произведения.


Обсуждение, отзывы о книге «Bioinformatics» и просто собственные мнения читателей. Оставьте ваши комментарии, напишите, что Вы думаете о произведении, его смысле или главных героях. Укажите что конкретно понравилось, а что нет, и почему Вы так считаете.