Tony Waters - Process Gas Chromatographs
Здесь есть возможность читать онлайн «Tony Waters - Process Gas Chromatographs» — ознакомительный отрывок электронной книги совершенно бесплатно, а после прочтения отрывка купить полную версию. В некоторых случаях можно слушать аудио, скачать через торрент в формате fb2 и присутствует краткое содержание. Жанр: unrecognised, на английском языке. Описание произведения, (предисловие) а так же отзывы посетителей доступны на портале библиотеки ЛибКат.
- Название:Process Gas Chromatographs
- Автор:
- Жанр:
- Год:неизвестен
- ISBN:нет данных
- Рейтинг книги:3 / 5. Голосов: 1
-
Избранное:Добавить в избранное
- Отзывы:
-
Ваша оценка:
Process Gas Chromatographs: краткое содержание, описание и аннотация
Предлагаем к чтению аннотацию, описание, краткое содержание или предисловие (зависит от того, что написал сам автор книги «Process Gas Chromatographs»). Если вы не нашли необходимую информацию о книге — напишите в комментариях, мы постараемся отыскать её.
Process Gas Chromatographs:
Fundamentals, Design and Implementation
Describes practical procedures for design and troubleshooting Contains concise chapters that provide a structured course for advanced students in process engineering Reviews the fundamentals of applied gas chromatography Details the operation and maintenance of process gas chromatographs Offers a summary, and self-assessment questions, for every chapter Is written by an international expert in the field with extensive industry knowledge and teaching experience in courses on process sampling systems and gas chromatography Written for process analyzer engineers and technicians, application engineers, and industrial environmental engineers, offers an essential guide to the basics of gas chromatography and reviews the applications of process gas chromatographs in industry today.
Process Gas Chromatographs — читать онлайн ознакомительный отрывок
Ниже представлен текст книги, разбитый по страницам. Система сохранения места последней прочитанной страницы, позволяет с удобством читать онлайн бесплатно книгу «Process Gas Chromatographs», без необходимости каждый раз заново искать на чём Вы остановились. Поставьте закладку, и сможете в любой момент перейти на страницу, на которой закончили чтение.
Интервал:
Закладка:
In Figure 3.1, none of the peaks have left the column yet, so your chromatogram needs to show a flat baseline for the first three minutes after injection – the so‐called “dead time.” It would be a mistake to draw any peaks in this zone.
The air peak is just leaving the column after three minutes of traveling. Since it doesn't dissolve in the liquid phase, its time in the liquid phase is zero. One way to indicate this is to show its gas:liquid residence time ratio as 3:0. Since the air molecules are not delayed in the liquid phase, the air peak should be very narrow, and it's reasonable to draw it centered at three minutes.
Most people find it very difficult to decide where the other peaks come out on the chromatogram, perhaps because the correct answer defies all expectations.
Actually, it's easy to get it right. Starting from the position of each peak in Figure 3.1, there are two ways of reaching the correct conclusion about its final position on the chromatogram. Both ways are noted below.
To locate the remaining peaks, it's easier to think about them in the following order, starting with the propane peak.
The propane peak took three minutes to reach the center of the column, so it should take another three minutes to reach the detector, for a retention time of six minutes overall. A better argument comes from its solubility ratio. Recall that retention time is the sum of the time a component spends in the gas phase and the time it spends in the liquid phase ( Equation 3.2). To reach the detector, the propane peak must spend three minutes traveling in the gas phase. But, because of its 50:50 solubility ratio, it also spends three minutes stopped in the liquid – so its residence time ratio is 3:3 for a total retention time of six minutes.
The 1‐butene peak took three minutes to move 25 % of the column length, so it should take four times as long to reach the detector, for a retention time of twelve minutes overall. A better argument invokes its solubility ratio. To reach the detector, the 1‐butene peak must spend three minutes traveling in the gas phase. But, because of its 25:75 solubility ratio, it also spends nine minutes stopped in the liquid – so its residence time ratio is 3:9 for a total retention time of twelve minutes.
The carbon dioxide peak took three minutes to move 75 % of the column length, so it should take one additional minute to travel the last 25 % of the column, for a retention time of four minutes overall. A better argument comes from its solubility ratio. To reach the detector, the carbon dioxide peak must spend three minutes traveling in the gas phase. But, because of its 75:25 solubility ratio, it also spends one minute stopped in the liquid – so its residence time ratio is 3:1 for a total retention time of four minutes.
Notice that the different molecules all spend exactly three minutes in the gas phase traveling.
Notice also that the peaks were equally spaced along the column, but not on the chromatogram. This may seem strange, but it's the normal behavior of columns and explains why early peaks tend to cluster close to the air peak location, while later ones have much longer retention times. In the next chapter, we'll look at these patterns of retention in more detail.
If you closely followed what is going on here, you may be thinking that the pressure drop along the column must distort the predictions made in the above arguments. That's somewhat true, but way too complex to consider at this early stage .
Measurements from chromatograms
A practical task
To evaluate various measures of column performance, we'll need to measure the peak retention time and the peak width. Some computer programs will make these measurements for you, but you won't get the significance of them until you learn to do it on a chromatogram.
Figure 3.4illustrates the most important measurements. Measure the variables in seconds or in millimeters. Many of our optimization parameters are ratios, so the units cancel out.
You can make simple measurements from a chromatogram to discover how well the columns are performing. The data most often collected are shown in this illustrative chromatogram above, and are further discussed in the text. 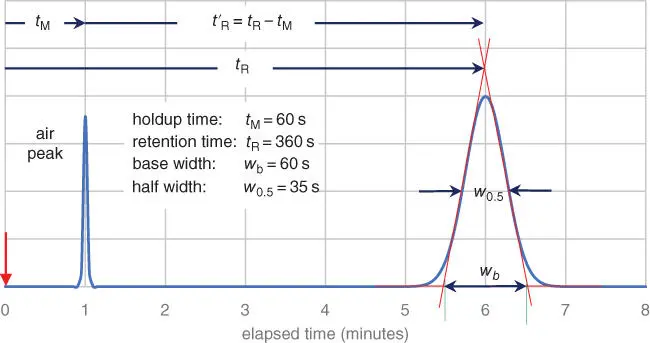
Figure 3.4Typical Chromatogram Measurements.
It's not possible to measure the actual peak width at the baseline because the peak gradually fades away. Instead, draw tangent lines along the flat sides of the peak and extend the baseline across the width of the peak. Chromatographers call this procedure triangulatingthe peak.
Some chromatographers prefer to measure the width of the peak at half its height. This is often easier to do than triangulating the base width, and perhaps more accurate, since no triangulation errors occur. The two width measurements are related, and either of them can be used to evaluate column performance.
Make the following measurements:
Measure the holdup time (tM) from the injection time mark to the apex of the air peak (you can triangulate the air peak if you wish).
Measure the retention time (tR) of each component peak from the injection time mark to the intersection of its tangent lines.
Measure the base width (wb) of each component peak between the intersections of the tangent lines with the extended baseline.
Alternatively, measure the width at half height (w0.5) of each component peak.
For clarity of display, Figure 3.4shows a single wide peak. You may have many peaks, and most likely they will be narrower than that. It's difficult to measure the width of a narrow peak. To obtain a good measurement, you may have to expand the time base on a computer display, or increase the chart speed on a recorder.
Typical calculations
These few measurements are enough to evaluate the performance of a single column. By way of example, let's calculate the plate number ( N ) for the peak in Figure 3.4. The math is not difficult:
(3.3) 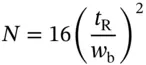
Inserting the data from Figure 3.4gives:

A plate number of 576 is very low and would indicate a very inefficient column, since most columns generate about 2000 plates per meter. Of course, this peak is intentionally drawn wide so the measurements are clearly seen. A real peak would be much narrower than this: a more typical peak might have one third of the width and nine times the plate number.
The alternative equation using the peak width at half height ( w 0.5) is:
(3.4) 
Chromatographers calculate plate number as a way to evaluate the performance of a column. Any change of operating parameters that increases plate number automatically improves the separating power of a column.
Another performance indicator is the plate height ( H ), which is the length of a column required to generate one plate. It's usually reported in mm. Knowing the column length ( L ), you can easily calculate the plate height:
(3.5) 
Интервал:
Закладка:
Похожие книги на «Process Gas Chromatographs»
Представляем Вашему вниманию похожие книги на «Process Gas Chromatographs» списком для выбора. Мы отобрали схожую по названию и смыслу литературу в надежде предоставить читателям больше вариантов отыскать новые, интересные, ещё непрочитанные произведения.


Обсуждение, отзывы о книге «Process Gas Chromatographs» и просто собственные мнения читателей. Оставьте ваши комментарии, напишите, что Вы думаете о произведении, его смысле или главных героях. Укажите что конкретно понравилось, а что нет, и почему Вы так считаете.