Samprit Chatterjee - Handbook of Regression Analysis With Applications in R
Здесь есть возможность читать онлайн «Samprit Chatterjee - Handbook of Regression Analysis With Applications in R» — ознакомительный отрывок электронной книги совершенно бесплатно, а после прочтения отрывка купить полную версию. В некоторых случаях можно слушать аудио, скачать через торрент в формате fb2 и присутствует краткое содержание. Жанр: unrecognised, на английском языке. Описание произведения, (предисловие) а так же отзывы посетителей доступны на портале библиотеки ЛибКат.

- Название:Handbook of Regression Analysis With Applications in R
- Автор:
- Жанр:
- Год:неизвестен
- ISBN:нет данных
- Рейтинг книги:3 / 5. Голосов: 1
-
Избранное:Добавить в избранное
- Отзывы:
-
Ваша оценка:
Handbook of Regression Analysis With Applications in R: краткое содержание, описание и аннотация
Предлагаем к чтению аннотацию, описание, краткое содержание или предисловие (зависит от того, что написал сам автор книги «Handbook of Regression Analysis With Applications in R»). Если вы не нашли необходимую информацию о книге — напишите в комментариях, мы постараемся отыскать её.
andbook and reference guide for students and practitioners of statistical regression-based analyses in R
Handbook of Regression Analysis
with Applications in R, Second Edition
The book further pays particular attention to methods that have become prominent in the last few decades as increasingly large data sets have made new techniques and applications possible. These include:
Regularization methods Smoothing methods Tree-based methods In the new edition of the
, the data analyst’s toolkit is explored and expanded. Examples are drawn from a wide variety of real-life applications and data sets. All the utilized R code and data are available via an author-maintained website.
Of interest to undergraduate and graduate students taking courses in statistics and regression, the
will also be invaluable to practicing data scientists and statisticians.
Handbook of Regression Analysis With Applications in R — читать онлайн ознакомительный отрывок
Ниже представлен текст книги, разбитый по страницам. Система сохранения места последней прочитанной страницы, позволяет с удобством читать онлайн бесплатно книгу «Handbook of Regression Analysis With Applications in R», без необходимости каждый раз заново искать на чём Вы остановились. Поставьте закладку, и сможете в любой момент перейти на страницу, на которой закончили чтение.
Интервал:
Закладка:

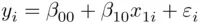
where  is an indicator variable with value
  if the observation is a member of group and
  otherwise. The usual interpretation of the slope still applies:
  is the expected change in
  associated with a one‐unit change in
  holding all else fixed. Since
  only takes on the values
  or
or  , this is equivalent to saying that the expected target is
  higher for group members (
  ) than nonmembers (
  ), holding all else fixed. This has the appealing interpretation of fitting a constant shift model, where the regression relationships for group members and nonmembers are identical, other than being shifted up or down; that is,

for nonmembers and

for members. The  ‐test for whether
  is thus a test of whether a constant shift model (two parallel regression lines, planes, or hyperplanes) is a significant improvement over a pooled model (one common regression line, plane, or hyperplane).
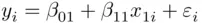
Would two different regression relationships be better still? Say there is only one numerical predictor  ; the full model that allows for two different regression lines is
for nonmembers (  ), and
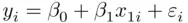
for members (  ). The pooled model and the constant shift model can be made to be special cases of the full model, by creating a new variable that is the product of
  and
and  . A regression model that includes this variable,

corresponds to the two different regression lines
for nonmembers (since  ), implying
  and
and  above, and
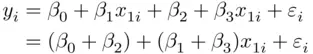
for members (since  ), implying
  and
and  above.
The  ‐test for the slope of the product variable (
  ) is a test of whether the full model (two different regression lines) is significantly better than the constant shift model (two parallel regression lines); that is, it is a test of parallelism. The restriction
  defines the pooled model as a special case of the full model, so the partial
  ‐statistic based on (2.1),
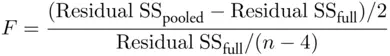
on  degrees of freedom, provides a test comparing the pooled model to the full model. This test is often called the Chow test(Chow, 1960) in the economics literature.
Интервал:
Закладка:
Похожие книги на «Handbook of Regression Analysis With Applications in R»
Представляем Вашему вниманию похожие книги на «Handbook of Regression Analysis With Applications in R» списком для выбора. Мы отобрали схожую по названию и смыслу литературу в надежде предоставить читателям больше вариантов отыскать новые, интересные, ещё непрочитанные произведения.


Обсуждение, отзывы о книге «Handbook of Regression Analysis With Applications in R» и просто собственные мнения читателей. Оставьте ваши комментарии, напишите, что Вы думаете о произведении, его смысле или главных героях. Укажите что конкретно понравилось, а что нет, и почему Вы так считаете.