Peter M. B. Cahusac - Evidence-Based Statistics
Здесь есть возможность читать онлайн «Peter M. B. Cahusac - Evidence-Based Statistics» — ознакомительный отрывок электронной книги совершенно бесплатно, а после прочтения отрывка купить полную версию. В некоторых случаях можно слушать аудио, скачать через торрент в формате fb2 и присутствует краткое содержание. Жанр: unrecognised, на английском языке. Описание произведения, (предисловие) а так же отзывы посетителей доступны на портале библиотеки ЛибКат.
- Название:Evidence-Based Statistics
- Автор:
- Жанр:
- Год:неизвестен
- ISBN:нет данных
- Рейтинг книги:5 / 5. Голосов: 1
-
Избранное:Добавить в избранное
- Отзывы:
-
Ваша оценка:
Evidence-Based Statistics: краткое содержание, описание и аннотация
Предлагаем к чтению аннотацию, описание, краткое содержание или предисловие (зависит от того, что написал сам автор книги «Evidence-Based Statistics»). Если вы не нашли необходимую информацию о книге — напишите в комментариях, мы постараемся отыскать её.
is an accessible and practical text filled with examples, illustrations and exercises. Additionally, the companion website complements and expands on the information contained in the book.
While the evidential approach is unlikely to replace probability-based methods of statistical inference, it provides a useful addition to any statistician’s “bag of tricks.” In this book:
It explains how to calculate statistical evidence for commonly used analyses, in a step-by-step fashion Analyses include: t tests, ANOVA (one-way, factorial, between- and within-participants, mixed), categorical analyses (binomial, Poisson, McNemar, rate ratio, odds ratio, data that’s ‘too good to be true’, multi-way tables), correlation, regression and nonparametric analyses (one sample, related samples, independent samples, multiple independent samples, permutation and bootstraps) Equations are given for all analyses, and R statistical code provided for many of the analyses Sample size calculations for evidential probabilities of misleading and weak evidence are explained Useful techniques, like Matthews’s critical prior interval, Goodman’s Bayes factor, and Armitage’s stopping rule are described Recommended for undergraduate and graduate students in any field that relies heavily on statistical analysis, as well as active researchers and professionals in those fields,
belongs on the bookshelf of anyone who wants to amplify and empower their approach to statistical analysis.
Evidence-Based Statistics — читать онлайн ознакомительный отрывок
Ниже представлен текст книги, разбитый по страницам. Система сохранения места последней прочитанной страницы, позволяет с удобством читать онлайн бесплатно книгу «Evidence-Based Statistics», без необходимости каждый раз заново искать на чём Вы остановились. Поставьте закладку, и сможете в любой момент перейти на страницу, на которой закончили чтение.
Интервал:
Закладка:
The support S will generally be expressed to only one decimal place. The use of S is merely a guide to the strength of evidence. It is graded rather than thresholded.
The evidential approach does not require any statistical tables. All calculations can be performed from first principles with a hand calculator, R or Excel spreadsheet.
1.5 Summary of the Evidential Approach
1 Choose a parameter value for primary hypothesis H1. Either a value corresponding to practical importance, of minimum importance, or the expected value. Else use a medium effect size, e.g. d = ±0.5. Alternatively, use the MLE.
2 Choose a secondary hypothesis H2 to compare with H1. Often this is the null hypothesis H0.
3 Calculate S12, S10 for H0, or SM for MLE.
4 Assess the relative evidence for the two hypotheses on the graded scale from −∞ to +∞.
5 Always use likelihood intervals, typically for S-2 and S-3. Likelihood intervals are more flexible and may be more informative than examining S for particular hypotheses.
6 If possible and convenient, plot the likelihood function.
Figure 1.3gives a flow diagram showing the sequence used to calculate and assess the evidence from a data sample.
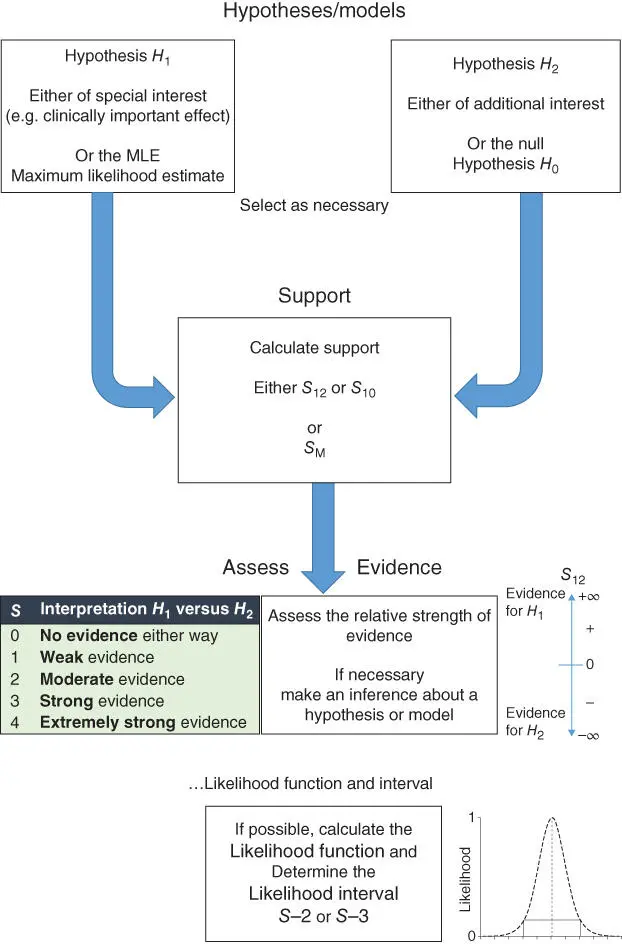
Figure 1.3 A flow diagram illustrating the general procedure of calculating and assessing evidence. At the top, we start with defining hypotheses of interest. The primary hypothesis H 1is that specified by an effect size or the sample statistic (maximum likelihood estimate (MLE)). The secondary hypothesis H 2specifies another value of interest, often this is the null hypothesis. The support S is calculated from the logarithm of the LR for H 1versus H 2. If the MLE is used then the maximum LR is calculated, which becomes S Mon taking logs. The value of S indicates the strength of evidence for one of the hypotheses against the other. If the value is negative then this represents evidence in favour of H 2. If the value is positive then this represents evidence in favour of the primary hypothesis H 1. The magnitude of the negative or positive support values indicates the relative strength of the evidence, from ±1 meaning weak, ±2 moderate, ±3 strong, and ≥±4 extremely strong. An LR of 1 represents an S of 0, which is no evidence in favour of either hypothesis. The likelihood function should be calculated wherever possible and likelihood interval provided when presenting results. Thanks to Alfaisal student, Muhammad Affan Elahi, for the suggestion to use flow charts here and for Figure 2.12.
References
1 1 Taper ML, Lele SR, editors. The Nature of Scientific Evidence: Statistical, Philosophical, and Empirical Considerations. Chicago: University of Chicago Press; 2004.
2 2 Pearson ES. ‘Student’ as statistician. Biometrika. 1939; 30 (3/4):210–50.
3 3 Edwards AWF. Likelihood. Baltimore: John Hopkins University Press; 1992.
4 4 Royall RM. Statistical Evidence: A Likelihood Paradigm. London: Chapman & Hall; 1997.
5 5 Hacking I. Logic of Statistical Inference. Cambridge: Cambridge University Press; 1965.
6 6 Dienes Z. Understanding Psychology as a Science: An Introduction to Scientific and Statistical Inference. Basingstoke: Palgrave MacMillan; 2008.
7 7 Baguley T. Serious Stats: A Guide to Advanced Statistics for the Behavioral Sciences. Basingstoke: Palgrave MacMillan; 2012.
8 8 Aitkin CGG, Taroni F. Statistics and the evaluation of evidence for forensic scientists. In: Barnett V, editor. (2nd ed). Chichester: John Wiley & Sons; 2004.
9 9 Pawitan Y. In All Likelihood: Statistical Modelling and Inference Using Likelihood. Oxford: Oxford University Press; 2001.
10 10 Clayton D, Hills M. Statistical Models in Epidemiology. Oxford: Oxford University Press; 2013.
11 11 Lindsey JK. Introductory Statistics: A Modelling Approach. Oxford: Clarendon Press; 1995.
12 12 Kirkwood BR, Sterne JAC. Essential Medical Statistics. 2nd ed. Oxford: Blackwell; 2003.
13 13 Armitage P, Berry G, Matthews JNS. Statistical Methods in Medical Research. Oxford: Wiley-Blackwell; 2002.
14 14 Maxwell SE, Delaney HD. Designing Experiments and Analyzing Data: A Model Comparison Perspective. Belmont: Wadsworth Publishing Company; 1990.
15 15 Judd CM, McClelland GH, Ryan CS. Data Analysis: A Model Comparison Approach to Regression, ANOVA, and Beyond (3rd ed): Routledge; 2017.
16 16 Edwards AWF. Likelihood in statistics. In: Wright JD, editor. International Encyclopedia of the Social and Behavioral Sciences (2nd ed). Oxford: Elsevier; 2015. p. 116–9.
17 17 Goodman SN. Toward evidence-based medical statistics. 1: The p value fallacy. Annals of Internal Medicine. 1999; 130 (12):995–1004.
18 18 Goodman SN. Toward evidence-based medical statistics. 2: The Bayes factor. Annals of Internal Medicine. 1999; 130 (12):1005–13.
19 19 Goodman SN, Royall R. Evidence and scientific research. American Journal of Public Health. 1988; 78 (12):1568–74.
20 20 Dixon P. The effective number of parameters in post hoc models. Behavior Research Methods. 2013; 45(3):604–12.
21 21 Goodman SN. Meta-analysis and evidence. Controlled Clinical Trials. 1989; 10(2):188–204.
22 22 Dixon P. The p-value fallacy and how to avoid it. Canadian Journal of Experimental Psychology/Revue canadienne de psychologie expérimentale. 2003; 57(3):189–202.
23 23 Glover S, Dixon P. Likelihood ratios: a simple and flexible statistic for empirical psychologists. Psychonomic Bulletin and Review. 2004; 11(5):791–806.
24 24 Royall R. The likelihood paradigm for statistical evidence. In: Taper ML, Lele SR, editors. The Nature of Scientific Evidence. Chicago: University of Chicago; 2004. p. 119–52.
25 25 de Winter P, Cahusac PMB. Starting Out in Statistics: An Introduction for Students of Human Health, Disease, and Psychology. Chichester: John Wiley & Sons; 2014.
26 26 Cumming G, Calin-Jageman R. Introduction to the New Statistics. New York: Routledge; 2017.
27 27 Fisher RA. Statistical Methods and Scientific Inference. Edinburgh: Oliver & Boyd; 1956.
28 28 Edwards AWF. Statistical methods in scientific inference. Nature. 1969; 222 (5200):1233–7.
29 29 Tsou T-S, Royall RM. Robust likelihoods. Journal of the American Statistical Association. 1995; 90 (429):316–20.
30 30 Salsburg DS. The religion of statistics as practiced in medical journals. American Statistician. 1985; 39(3):220–3.
31 31 Cohen J. Things I have learned (so far). American Psychologist. 1990; 45 (12):1304-12.
32 32 Tukey JW. The philosophy of multiple comparisons. Statistical Science. 1991; 6(1):100–16.
33 33 Baguley T. Standardized or simple effect size: what should be reported? British Journal of Psychology. 2009; 100(3):603–17.
Notes
1 1Taper and Lele (p. 545) emphasis added 'The evidential approach is alone … in having its measure of evidence invariant to intent, belief, and time of hypothesis formulation. The evidence is the evidence. Both belief and error probabilities have been separated from evidence. This is not to say that belief and error probabilities are unimportant in making inferences, but only that belief, error probabilities, and evidence can be most effectively used for inference if they are not conflated' [1].
2 2The counternull is the value on the other side of the sample mean that is equidistant from the sample mean as the null is from the sample mean. See Section 8.7.
3 3Often the secondary hypothesis will be the null hypothesis.
Читать дальшеИнтервал:
Закладка:
Похожие книги на «Evidence-Based Statistics»
Представляем Вашему вниманию похожие книги на «Evidence-Based Statistics» списком для выбора. Мы отобрали схожую по названию и смыслу литературу в надежде предоставить читателям больше вариантов отыскать новые, интересные, ещё непрочитанные произведения.


Обсуждение, отзывы о книге «Evidence-Based Statistics» и просто собственные мнения читателей. Оставьте ваши комментарии, напишите, что Вы думаете о произведении, его смысле или главных героях. Укажите что конкретно понравилось, а что нет, и почему Вы так считаете.