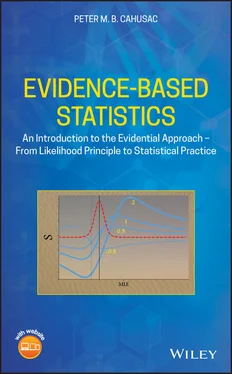
1 Cover
2 Acknowledgements Acknowledgements I would like to thank several people who influenced me during the writing of this book. I am fortunate and honoured to have made acquaintance with Professor A.W.F. Edwards (University of Cambridge) and thank him for his suggestions and reprints. I appreciate the replies to my questions from Professor P. Dixon (University of Alberta) and Dr Scott Glover (University of London). This book would have been difficult to complete without the support of my loving wife Annah Adero. Finally, this book is dedicated to the College of Medicine at Alfaisal University in Riyadh.
3 About the Author About the Author Peter M.B. Cahusac graduated with BSc Hons in Psychology from St Andrews University in 1980, followed by a PhD in neuropharmacology from the Medical School Bristol University in 1984. During a post-doctoral at Oxford position, he became interested in statistics and subsequently obtained an MSc in Applied Statistics from Oxford University in 1992. He taught statistics at Stirling University from 1990 to 2012. He was elected ordinary member of the Physiological Society (UK) since 1993 and then elected Fellow (FTPS) from 2018. He has been a member of the British Pharmacological Society since 2006. He is Fellow of the Royal Statistical Society, and GradStat status since 2009. From 2008, he became particularly interested in the likelihood approach to statistical inference as it appeared to avoid some of the difficulties associated with other approaches. In 2014, along with Dr Patricia de Winter, he published an introductory book on statistics. Currently, he is Associate Professor in Biostatistics and Pharmacology at Alfaisal University, Riyadh, Saudi Arabia.
4 About the Companion Site About the Companion Site This book is accompanied by a companion website: www.wiley.com/go/evidencebasedstatistics The website includes materials for students (open access): R statistical code for likelihood ratio and support calculations Answers
5 Introduction References
6 1 The Evidence is the Evidence 1.1 Evidence-Based Statistics 1.2 Statistical Inference – The Basics 1.3 Effect Size – True If Huge! 1.4 Calculations 1.5 Summary of the Evidential Approach References Notes
7 2 The Evidential Approach 2.1 Likelihood 2.2 Misleading and Weak Evidence 2.3 Adding More Data and Multiple Testing 2.4 Sequence of Calculations Using t 2.5 Likelihood Terminology 2.6 R Code for Chapter 2 2.7 Exercises References Notes
8 3 Two Samples 3.1 Basics Using the t Distribution 3.2 Related Samples 3.3 Independent Samples 3.4 Calculation Simplification 3.5 If Variance Is Known, or Large Sample Size, Use z 3.6 Methodological and Pro Forma Analyses 3.7 Adding More Data 3.8 Estimating Sample Size 3.9 Differences in Variances 3.10 R Code For Chapter 3 3.11 Exercises References Notes
9 4 ANOVA 4.1 Multiple Means 4.2 Example – Fitness 4.3 Factorial ANOVA 4.4 Alerting r 2 4.5 Repeated Measures Designs 4.6 Exercise References Notes
10 5 Correlation and Regression 5.1 Relationships Between Two Variables 5.2 Correlation 5.3 Regression 5.4 Logistic Regression 5.5 Exercises References Notes
11 6 Categorical Data 6.1 Types of Categorical Data 6.2 Binomial 6.3 Poisson 6.4 Rate Ratios 6.5 One-Way Categorical Data 6.6 2 × 2 Contingency Tables 6.7 Larger Contingency Tables 6.8 Data That Fits a Hypothesis Too Well 6.9 Transformations of the Variable 6.10 Clinical Trials – A Tragedy in 3 Acts 6.11 R Code for Chapter 6 6.12 Exercises References Notes
12 7 Nonparametric Analyses 7.1 So-Called ‘Distribution-Free’ Statistics 7.2 Hacking SM 7.3 One Sample and Related Samples 7.4 Independent Samples 7.5 More than Two Independent Samples 7.6 Permutation Analyses 7.7 Bootstrap Analyses for One Sample or Related Samples 7.8 R Code for Chapter 7 7.9 Exercises References
13 8 Other Useful Techniques 8.1 Other Techniques 8.2 Critical Prior Interval 8.3 False Positive Risk 8.4 The Bayes Factor and the Probability of the Null Hypothesis 8.5 Bayesian t Tests 8.6 The Armitage Stopping Rule 8.7 Counternull Effect Size References Notes
14 Appendix A: Orthogonal Polynomials
15 Appendix B: Occam's Bonus Reference
16 Appendix C: Problems with p Values C.1 The Misuse of p Values C.2 The Use of p Values References
17 Index
18 End User License Agreement
1 Chapter 2 Table 2.1 Interpreting support. Table 2.2 Likelihood values used in British courts to aid the jury in decidin...Table 2.3 S -likelihood interval values and their corresponding frequentist confid...
2 Chapter 3Table 3.1 How sample size affects S and p .Table 3.2 Values for strength of evidence S are given in the left column and p...
3 Chapter 4Table 4.1 Fitness data for 40 participants.Table 4.2 ANOVA summary table for an independent group's analysis.Table 4.3 Data and means for skill according to weeks of training.Table 4.4 ANOVA summary table for an independent group's analysis for the pra...Table 4.5 Contrast weights for linear and quadratic models, with calculated S...Table 4.6 As in the previous Table 4.5, showing weights and calculations for ...Table 4.7 Blood clotting times in haemophiliac patients and normal volunteers...Table 4.8 Summary table for blood clotting data in a two-way factorial ANOVA.Table 4.9 Blood clotting time means as plotted in Figure 4.4.Table 4.10 Data on additional sleep obtained following three different drugs a...Table 4.11 ANOVA summary for a one-way repeated measures design.Table 4.12 The same data as in Table 4.10 with the patient's sex added in the...Table 4.13 ANOVA summary for within and between participants design of data s...Table 4.14 Means and weights used for the contrast.Table 4.15 Means and weights used for the second contrast.
4 Chapter 5Table 5.1 Summary of a regression analysis given as SS in ANOVA format.Table 5.2 Summary of a polynomial regression fit given in ANOVA format.Table 5.3 Prescription errors made by doctors in a hospital.Table 5.4 Output obtained using R.Table 5.5 Calculation of the log likelihood for the full model.Table 5.6 The same as Table 5.5 but for a model consisting only of a constant...Table 5.7 Summary of logistic regression analysis when the variable scoreis r...Table 5.8 The same as Table 5.5 but for a model without the scorevariable.Table 5.9 Summary output obtained in R.
5 Chapter 6Table 6.1 A week's data of butterfly sightings.Table 6.2 Two hundred patients assessed with a CT scan either show positive s...Table 6.3 The same data as Table 6.2 but with a prevalence of 0.1.Table 6.4 The effects of disease prevalence on statistics.Table 6.5 The results from using an ultrascan on the same 200 patients as bef...Table 6.6 Matched sample tables (a) and (b), representing diseased and health...Table 6.7 The numbers represent a total of 288 individuals who are either pos...Table 6.8 Table 6.7 data with extra rows incorporating the age variable x .
6 Chapter 7Table 7.1 Calculations going from raw data on the left to normal scores, and ...Table 7.2 The same calculations as were performed in Table 7.1, except that t...Table 7.3 Subtracting 5 from just the group 1 scores (first column), calculat...Table 7.4 For the second hypothesis, calculated values of ranks, quantiles, v...Table 7.5 Outputs from running the R code to obtain bootstrap estimates.Table 7.6 Bootstrap estimate from running the R code for two independent samp...
7 Chapter 8Table 8.1 Estimates obtained using the FPR calculator for different total sam...Table 8.2 Exchange rates between p values, likelihood ratios, and posterior pr...Table 8.3 Comparison between likelihood ratios obtained by JZS Bayes factor a...
Читать дальше


