Katherine Kula - Cephalometry in Orthodontics
Здесь есть возможность читать онлайн «Katherine Kula - Cephalometry in Orthodontics» — ознакомительный отрывок электронной книги совершенно бесплатно, а после прочтения отрывка купить полную версию. В некоторых случаях можно слушать аудио, скачать через торрент в формате fb2 и присутствует краткое содержание. Жанр: unrecognised, на английском языке. Описание произведения, (предисловие) а так же отзывы посетителей доступны на портале библиотеки ЛибКат.
- Название:Cephalometry in Orthodontics
- Автор:
- Жанр:
- Год:неизвестен
- ISBN:нет данных
- Рейтинг книги:4 / 5. Голосов: 1
-
Избранное:Добавить в избранное
- Отзывы:
-
Ваша оценка:
Cephalometry in Orthodontics: краткое содержание, описание и аннотация
Предлагаем к чтению аннотацию, описание, краткое содержание или предисловие (зависит от того, что написал сам автор книги «Cephalometry in Orthodontics»). Если вы не нашли необходимую информацию о книге — напишите в комментариях, мы постараемся отыскать её.
Cephalometry in Orthodontics — читать онлайн ознакомительный отрывок
Ниже представлен текст книги, разбитый по страницам. Система сохранения места последней прочитанной страницы, позволяет с удобством читать онлайн бесплатно книгу «Cephalometry in Orthodontics», без необходимости каждый раз заново искать на чём Вы остановились. Поставьте закладку, и сможете в любой момент перейти на страницу, на которой закончили чтение.
Интервал:
Закладка:
Early studies by Broadbent 14and other investigators of cranial and facial development emphasized the need to identify stable landmarks in order to superimpose the radiographs. Broadbent thought that at least in early childhood, certain cranial areas were more stable than the rapidly growing face. This led to the development of the Bolton-nasion plane of orientation and a registration point (R) in the sphenoidal area as the most fixed point in the head or face 14( Fig 1-6). The Bolton-nasion plane was a line drawn from nasion, the most forward position of the frontonasal suture, at the midline to the highest point (Bolton point) on the profile of the right and left condyles of the occipital bone posterior to the foramen magnum. Bolton point was chosen rather than the superior tip of the auditory meatus because the cephalostat’s ear rods masked the auditory canals. The bilateral occipital condyles were considered to produce a single image because they were essentially close enough to each other to be on the midplane of the skull. The center ray of the radiographic machine was considered to cause little magnification shadow. A point midway on a line drawn from the center of sella turcica on a perpendicular to the Bolton-nasion plane was called registration point (R) and was used to register superimpositions of the same individual or different individuals.
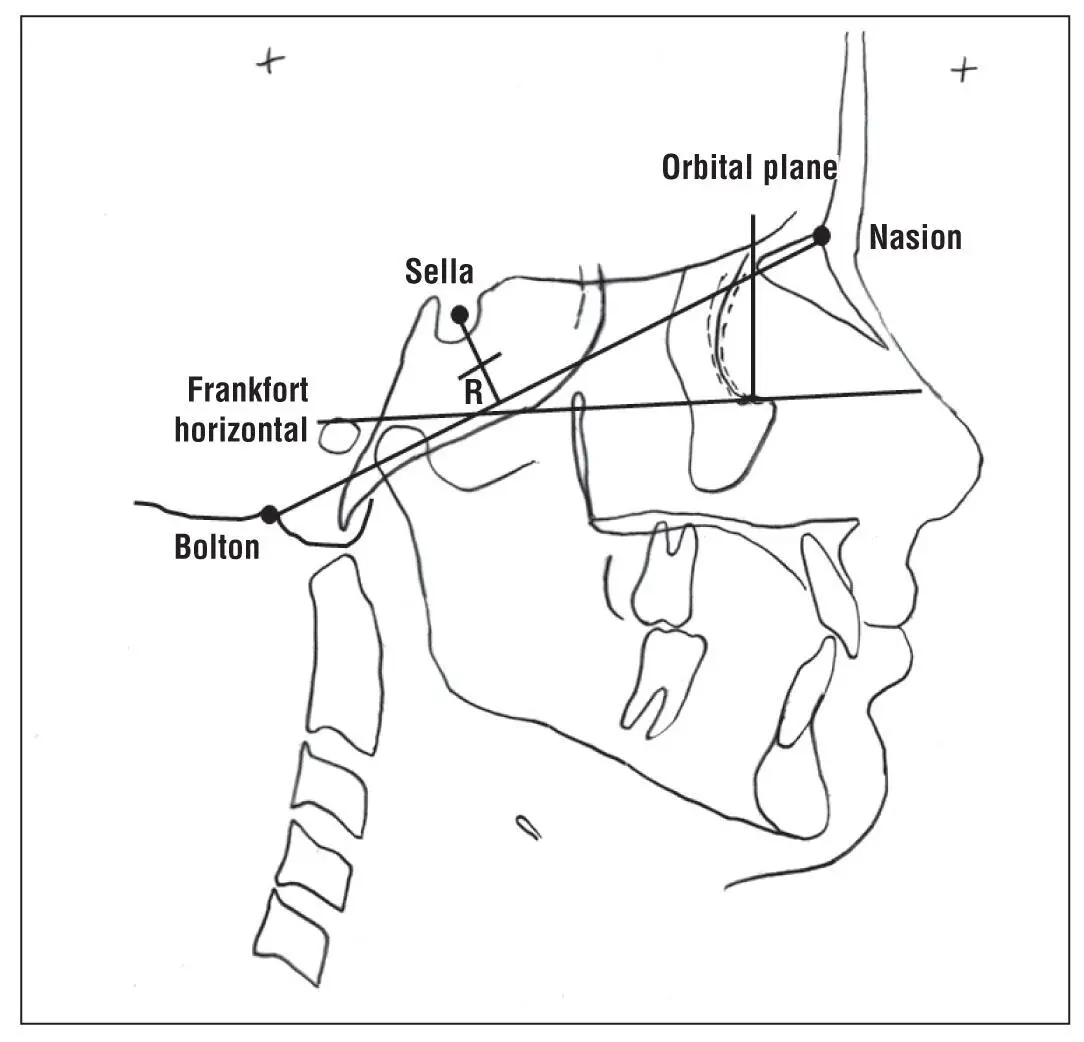
Fig 1-6Bolton-nasion plane of orientation and registration point (R) in the sphenoidal area. The Frankfort horizontal and the perpendicular orbital plane were used for superimpositions.
To measure facial changes after registering the Bolton-nasion plane on R, the Frankfort horizontal plane was added to the initial record of each child, and the perpendicular orbital plane (the plane perpendicular to Frankfort horizontal through orbitale) was passed through the dentition. Measurements of changes were taken from these two planes, not directly from the Bolton-nasion plane.
During the next few decades, multiple centers evaluating growth and development using cephalograms were started, and numerous orthodontists provided their data in various formats to best describe their analysis of the craniofacial complex. Some parameters were used primarily for research, while others were specifically used for clinical analysis. Many analyses or groups of parameters assumed the names of the orthodontist best known for promoting them but included measures previously used in craniometry or by other orthodontists. In some cases (eg, mandibular plane, length of mandible, and cranial base) various orthodontists published somewhat different methods of defining the structures. Wilton Krogman and Viken Sassouni attempted to validate the clinical usefulness of approximately 70 existing cephalometric analyses in 1957. 15In some cases, these differences remain today because of strongly held opinions of the different schools of orthodontics. Unfortunately, this has also led to confusion for novices in this area and to intense discussion about which cephalometric values lend more to correct diagnosis and treatment analysis. In addition, comparison of various studies is complicated when different landmarks and planes are used.
Many cephalometric values were reported as simple descriptive statistics. Descriptive statistics, which are used to indicate the center or most typical value of a data set, are called measures of central tendency and include means and medians. The mean is the average of all the numbers for that data set, and the median is the data value in the middle of all the data arranged in ascending or descending order. Means or averages are provided more commonly than medians to clinically compare cephalometric values of groups. Research studies might report one or both values depending on the purpose and the sample in the study. However, data sets with the same mean can have considerable variation in the incorporated values. The descriptive statistics used to quantitatively describe these differences are called measures of dispersion (how widely the values are dispersed). The two measures of dispersion commonly used in cephalometrics are range and standard deviation. The range of a data set is the difference between the largest and the smallest value in that data set. The larger the difference, the greater is the dispersion of the data. The standard deviation tells how much deviation there is from the mean. The larger the standard deviation, the larger is the variation of the data. Usually, all data within a data set fall within three standard deviations (±3 SD) of the mean. Clinically, some orthodontists suggest that it is more difficult to treat patients whose cephalometric values are more than one standard deviation outside the mean; however, this also depends on the particular cephalometric value.
For the most part, it is assumed that the skeletal and dental cephalometric traits have values that, if plotted, would fall within a bell-shaped curve, a normal curve. That is, if the mean was determined and designated as zero, then when standard deviations are determined and marked on each side of the mean, the normal curve would be symmetric, and most of the data would fall within three standard deviations on each side. Depending on the range and the width of the standard deviations, the curve could be taller than wide or vice versa. However, normality should always be checked because not all data sets fit a bell-shaped curve. Unfortunately, many of the classic cephalometric studies did not report adequate statistics. Therefore, a careful reading of the literature is required for knowledgeable use of cephalometrics.
Many published cephalometric studies reported descriptive statistics to quantify the results of the cephalometric parameters for samples of the population they studied. In most cases, the study included a limited number of cases (sample) compared with the entire population. Samples were used because it was too difficult or expensive to study the entire population. Obviously, the more alike the individuals in a population, the more representative the selection of the sample would be for that population. However, the criteria for the samples used in some of the early cephalometric analyses were very limiting and probably did not truly represent the population. In other cases, the samples were so small and heterogenous that the results reported appear to have little value. Some criteria for subject selection included that the subjects must have acceptable, attractive, 16or award-winning faces. 17
In one study 18of 79 adults with ideal occlusions, the cephalometric measures showed a large range of values from Class II to Class III maxillomandibular relationships, high-angle to low-angle mandibles, and incisor retrusion to protrusion. Although the means measured in the study were similar to those reported in other published studies, the ranges were considerably larger. A retrospective review of the faces indicated no extremely poor or unacceptable faces, showing that good occlusion was achievable even naturally without surgery. Thus, cephalometrics alone is never used for treatment decisions.
Various factors influence cephalometric values. For example, the measurement of 2D cephalometric parameters is influenced by the diverging rays of the cephalostat striking a multidimensional object that is at a distance from the recording film, causing magnification error. Prior to standardization of the distances of the object and the film from the x-ray source, the differential was unknown unless a standardizing object was included in the film. Magnification error also varies with different machines. Some early studies did not report or correct the magnification error when they were published. (Formerly, the American Board of Orthodontics required that cases submitted for board certification show a calibration device in the cephalogram to allow for correction of magnification error.) Despite these problems, the early studies were helpful in developing a better understanding of craniofacial growth and development and provided the basis for additional investigation. However, these original publications should be analyzed carefully before they are cited or used as a basis for clinical treatment.
Читать дальшеИнтервал:
Закладка:
Похожие книги на «Cephalometry in Orthodontics»
Представляем Вашему вниманию похожие книги на «Cephalometry in Orthodontics» списком для выбора. Мы отобрали схожую по названию и смыслу литературу в надежде предоставить читателям больше вариантов отыскать новые, интересные, ещё непрочитанные произведения.


Обсуждение, отзывы о книге «Cephalometry in Orthodontics» и просто собственные мнения читателей. Оставьте ваши комментарии, напишите, что Вы думаете о произведении, его смысле или главных героях. Укажите что конкретно понравилось, а что нет, и почему Вы так считаете.