Matthew B. Hamilton - Population Genetics
Здесь есть возможность читать онлайн «Matthew B. Hamilton - Population Genetics» — ознакомительный отрывок электронной книги совершенно бесплатно, а после прочтения отрывка купить полную версию. В некоторых случаях можно слушать аудио, скачать через торрент в формате fb2 и присутствует краткое содержание. Жанр: unrecognised, на английском языке. Описание произведения, (предисловие) а так же отзывы посетителей доступны на портале библиотеки ЛибКат.
- Название:Population Genetics
- Автор:
- Жанр:
- Год:неизвестен
- ISBN:нет данных
- Рейтинг книги:4 / 5. Голосов: 1
-
Избранное:Добавить в избранное
- Отзывы:
-
Ваша оценка:
Population Genetics: краткое содержание, описание и аннотация
Предлагаем к чтению аннотацию, описание, краткое содержание или предисловие (зависит от того, что написал сам автор книги «Population Genetics»). Если вы не нашли необходимую информацию о книге — напишите в комментариях, мы постараемся отыскать её.
is the classic, accessible introduction to the concepts of population genetics. Combining traditional conceptual approaches with classical hypotheses and debates, the book equips students to understand a wide array of empirical studies that are based on the first principles of population genetics.
Featuring a highly accessible introduction to coalescent theory, as well as covering the major conceptual advances in population genetics of the last two decades, the second edition now also includes end of chapter problem sets and revised coverage of recombination in the coalescent model, metapopulation extinction and recolonization, and the fixation index.
Population Genetics — читать онлайн ознакомительный отрывок
Ниже представлен текст книги, разбитый по страницам. Система сохранения места последней прочитанной страницы, позволяет с удобством читать онлайн бесплатно книгу «Population Genetics», без необходимости каждый раз заново искать на чём Вы остановились. Поставьте закладку, и сможете в любой момент перейти на страницу, на которой закончили чтение.
Интервал:
Закладка:
| Species | Mating system |  |
Method | References |
|---|---|---|---|---|
| Humans | ||||
| Homo sapiens | outcrossed | 0.0001–0.046 | pedigree | Jorde (1997) |
| Snail | ||||
| Bulinus truncates | selfed & outcrossed | 0.6–1.0 | microsatellites | Viard et al. (1997) |
| Domestic dogs | ||||
| Breeds combined | outcrossed | 0.33 | allozyme | Christensen et al. (1985) |
| German Shepard | outcrossed | 0.10 | ||
| Mongrels | outcrossed | 0.06 | ||
| Plants | ||||
| Arabidopsis thaliana | Selfed | 0.99 | allozyme | Abbott et al. (1989) |
| Pinus ponderosa | outcrossed | −0.37 | allozyme | Brown (1979) |
Box 2.2Protein locus or allozyme genotyping
Determining the genotypes of individuals at enzymatic protein loci is a rapid technique to estimate genotype frequencies in populations. Protein analysis was the primary molecular genotyping technique for several decades before DNA‐based techniques became widely available. Alleles at loci that code for proteins with enzymatic function can be ascertained in a multi‐step process. First, fresh tissue samples are ground up under conditions that preserve the function of proteins. Next, these protein extracts are loaded onto starch gels and exposed to an electric field. The electrical current results in electrophoresis where proteins are separated based on their ratio of molecular charge to molecular weight. Once electrophoresis is complete, the gel is then “stained” to visualize specific enzymes. The primary biochemical products of protein enzymes are not themselves visible. However, a series of biochemical reactions in a process called enzymatic coupling can be used to eventually produce a visible product (often nitro blue tetrazolium or NBT) at the site where the enzyme is active (see Figure 2.11). If different DNA sequences at a protein enzyme locus result in different amino acid sequences that differ in net charge, then multiple alleles will appear in the gel after staining. The term allozyme (also known as isozyme) is used to describe the multiple allelic staining variants at a single protein locus. Allozyme electrophoresis and staining detects only a subset of genetic variation at protein coding loci. Amino acid changes that are charge neutral and nucleotide changes that are synonymous (do not alter the amino acid sequence) cannot be detected by allozyme electrophoresis methods. Refer to Manchenko (2003) for a technical introduction and detailed methods of allozyme detection.
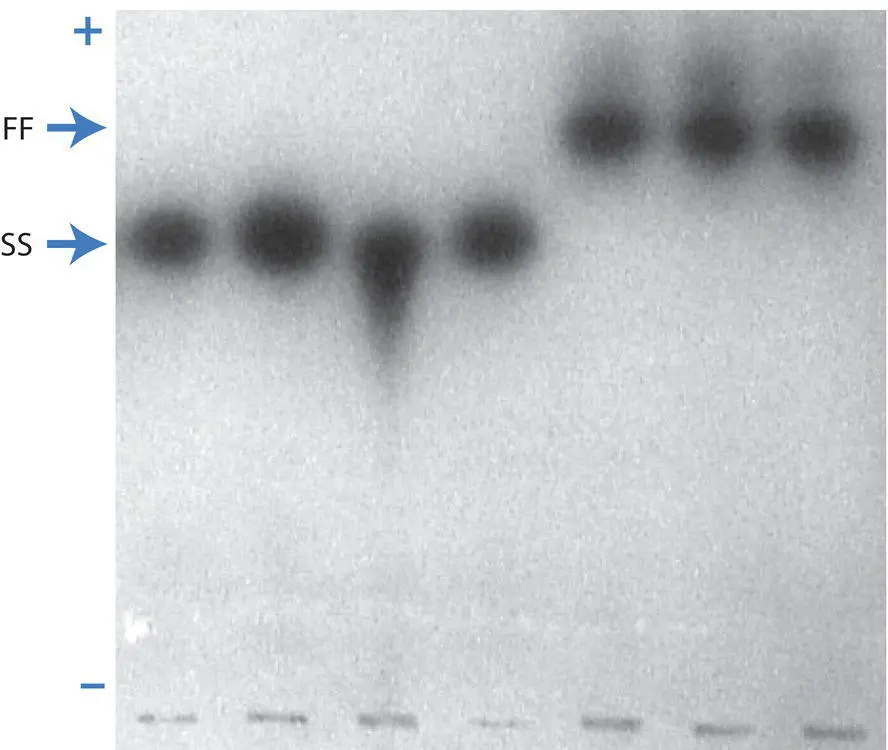
Figure 2.11 An allozyme gel stained to show alleles at the phosphoglucomutase or PGM locus in striped bass and white bass. The right‐most three individuals are homozygous for the faster migrating allele (FF genotype), while the left‐most four individuals are homozygous for the slower migrating allele (SS genotype). No double‐banded heterozygotes (FS genotype) are visible on this gel. The + and – indicate the anode and cathode, respectively, ends of the gel. Wells where the individual samples were loaded into the gel can be seen at the bottom of the picture. Gel picture kindly provided by J. Epifanio.
(2.12) 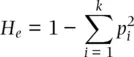
where k is the number of alleles at the locus, the p i 2and 2 p i p jterms represent the expected homozygote genotype frequencies with random mating based on allele frequencies, and  indicates summation of the frequencies of the k homozygous genotypes. Under random mating,
 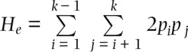 . This quantity was called the gene diversityby Nei (1973) to distinguish it from the heterozygosity when there is non‐random mating within populations and to recognize that it is a quantity that can be applied to polyploids (see Meirmans et al. 2018). The expected heterozygosity can be adjusted for small samples by multiplying H eby 2 N /(2 N − 1) where N is the total number of genotypes (Nei and Roychoudhury 1974), a correction that makes little difference unless N is about 50 or fewer individuals. In a similar manner, the observed heterozygosity ( H o) is the sum of the frequencies of all heterozygotes observed in a sample of genotypes:
(2.13) 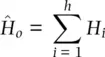
where the observed frequency of each heterozygous genotype H iis summed over the h = k ( k − 1)/2 heterozygous genotypes possible with k alleles. Both H eand H ocan be averaged over multiple loci to obtain mean heterozygosity estimates for two or more loci. Heterozygosity provides one of the basic measures of genetic variation, or more formally genetic polymorphism, in population genetics.
The fixation index as a measure of deviation from expected levels of heterozygosity is a critical concept that will appear in several places later in this text. The fixation index plays a conceptual role in understanding the effects of population size on heterozygosity ( Chapter 3) and also serves as an estimator of the impact of population structure on the distribution of genetic variation ( Chapter 4).
2.6 Mating among relatives
Mating among relatives alters genotype frequencies but not allele frequencies.
Mating among relatives and the probability that two alleles are identical by descent.
The coancestry coefficient and autozygosity.
Phenotypic consequences of mating among relatives.
Inbreeding depression and its possible causes.
The many meanings of inbreeding.
The previous section of this chapter showed how non‐random mating can increase or decrease the frequency of heterozygote genotypes compared to the frequency that is expected with random mating. The last section also introduced the fixation index as well as ways to quantify heterozygosity in a population. This section will build on that foundation to show two concepts: (i) the consequences of non‐random mating on allele and genotype frequencies in a population and (ii) the probability that two alleles are identical by descent. The focus will be on positive genotypic assortative mating (like genotypes mate) or inbreeding since this will eventually be helpful to understand genotype frequencies in small populations. The end of this section will consider some of the consequences of inbreeding and the evolution of autogamy.
Impacts of non‐random mating on genotype and allele frequencies
Интервал:
Закладка:
Похожие книги на «Population Genetics»
Представляем Вашему вниманию похожие книги на «Population Genetics» списком для выбора. Мы отобрали схожую по названию и смыслу литературу в надежде предоставить читателям больше вариантов отыскать новые, интересные, ещё непрочитанные произведения.


Обсуждение, отзывы о книге «Population Genetics» и просто собственные мнения читателей. Оставьте ваши комментарии, напишите, что Вы думаете о произведении, его смысле или главных героях. Укажите что конкретно понравилось, а что нет, и почему Вы так считаете.