Matthew B. Hamilton - Population Genetics
Здесь есть возможность читать онлайн «Matthew B. Hamilton - Population Genetics» — ознакомительный отрывок электронной книги совершенно бесплатно, а после прочтения отрывка купить полную версию. В некоторых случаях можно слушать аудио, скачать через торрент в формате fb2 и присутствует краткое содержание. Жанр: unrecognised, на английском языке. Описание произведения, (предисловие) а так же отзывы посетителей доступны на портале библиотеки ЛибКат.
- Название:Population Genetics
- Автор:
- Жанр:
- Год:неизвестен
- ISBN:нет данных
- Рейтинг книги:4 / 5. Голосов: 1
-
Избранное:Добавить в избранное
- Отзывы:
-
Ваша оценка:
Population Genetics: краткое содержание, описание и аннотация
Предлагаем к чтению аннотацию, описание, краткое содержание или предисловие (зависит от того, что написал сам автор книги «Population Genetics»). Если вы не нашли необходимую информацию о книге — напишите в комментариях, мы постараемся отыскать её.
is the classic, accessible introduction to the concepts of population genetics. Combining traditional conceptual approaches with classical hypotheses and debates, the book equips students to understand a wide array of empirical studies that are based on the first principles of population genetics.
Featuring a highly accessible introduction to coalescent theory, as well as covering the major conceptual advances in population genetics of the last two decades, the second edition now also includes end of chapter problem sets and revised coverage of recombination in the coalescent model, metapopulation extinction and recolonization, and the fixation index.
Population Genetics — читать онлайн ознакомительный отрывок
Ниже представлен текст книги, разбитый по страницам. Система сохранения места последней прочитанной страницы, позволяет с удобством читать онлайн бесплатно книгу «Population Genetics», без необходимости каждый раз заново искать на чём Вы остановились. Поставьте закладку, и сможете в любой момент перейти на страницу, на которой закончили чтение.
Интервал:
Закладка:
This is an example of the DNA sequence found at a microsatellite locus. This sequence is the 24.1 allele from the fibrinogen alpha chain gene, or FGA locus (Genbank accession no. AY749636; see Figure 2.8). The integral repeat is the 4 bp sequence CTTT, and most alleles have sequences that differ by some number of full CTTT repeats. However, there are exceptions where alleles have sequences with partial repeats or stutters in the repeat pattern, for example, the TTTCT and CTC sequences imbedded in the perfect CTTT repeats. In this case, the 24.1 allele is 1 bp longer than the 24‐allele sequence.
| GCCCCATAGGTTTTGAACTCACAGATTAAACTGTAACCAAAATAAAATTAGGCATTATTTACAAGCTAGTTT CTTT CTTT CTTT TTTCT CTTT CTTT CTTT CTTT CTTT CTTT CTTT CTTT CTTT CTTT CTTT CTTT CTTT CTTT CTTT CTTT CTC CTTC CTTC CTTT CTTC CTTT CTTT TTTGCTGGCA ATTACAGACAAATCAA |
Table 2.4 Expected numbers of each of the three MN blood group genotypes under the null hypotheses of Hardy–Weinberg. Genotype frequencies are based on a sample of 1066 Chukchi individuals, a native people of eastern Siberia (Roychoudhury and Nei 1988).
Frequency of M =  = 0.4184 Frequency of N = = 0.4184 Frequency of N =  = 0.5816 = 0.5816 |
|||
|---|---|---|---|
| Genotype | Observed | Expected number of genotypes | Observed – Expected |
| MM | 165 |  = 1066 × (0.4184) 2= 186.61 = 1066 × (0.4184) 2= 186.61 |
−21.6 |
| MN | 562 |  = 1066 × 2(0.4184)(0.5816) = 518.80 = 1066 × 2(0.4184)(0.5816) = 518.80 |
43.2 |
| NN | 339 |  = 1066 × (0. 5816) 2= 360.58 = 1066 × (0. 5816) 2= 360.58 |
−21.6 |
In more general terms, the expected frequency of an event, p , times the number of trials or samples, n , gives the expected number of events or np . To test the hypothesis that p is the frequency of an event in an actual population, we compare np with  . Close agreement suggests that the parameter and the estimate are the same quantity. But a large disagreement instead suggests that p and
  are likely to be different probabilities. The chi‐squared (χ 2) distribution is a statistical test commonly used to compare np and
  . The χ 2test provides the probability of obtaining the difference (or more) between the observed
  and expected ( np ) number of outcomes by chance alone if the null hypothesis is true . As the difference between the observed and expected grows larger, it becomes less probable that the parameter and the parameter estimate are actually the same but differ in a given sample due to chance. The χ 2statistic is:
(2.7) 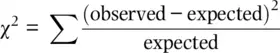
where ∑ (pronounced “sigma”) indicates taking the sum of multiple terms.
The χ 2formula makes intuitive sense. In the numerator, there is a difference between the observed and Hardy–Weinberg expected number of individuals. This difference is squared, like a variance, since we do not care about the direction of the difference but only the magnitude of the difference. Then, in the denominator, we divide by the expected number of individuals to make the squared difference relative. For example, a squared difference of 4 is small if the expected number is 100 (it is 4%) but relatively larger if the expected number is 8 (it is 50%). Adding all of these relative squared differences gives the total relative squared deviation observed over all genotypes.
(2.8) 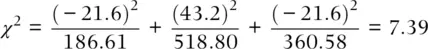
We need to compare our statistic to values from the χ 2distribution. But, first, we need to know how much information, or the degrees of freedom (commonly abbreviated as df), was used to estimate the χ 2statistic. In general, degrees of freedom are based on the number of categories of data: df = no. of classes compared − no. of parameters estimated −1 for the χ 2test itself. In this case, df = 3–1 − 1 = 1 for three genotypes and one estimated allele frequency (with two alleles: the other allele frequency is fixed once the first has been estimated).
Figure 2.9shows a χ 2distribution for one degree of freedom. Small deviations of the observed from the expected are more probable since they leave more area of the distribution to the right of the χ 2value. As the χ 2value gets larger, the probability that the difference between the observed and expected is just due to chance sampling decreases (the area under the curve to the right gets smaller). Another way of saying this is that as the observed and expected get increasingly different, it becomes more improbable that our null hypothesis of Hardy–Weinberg is actually the process that is determining genotype frequencies. Using Table 2.5, we see that a χ 2value of 7.46 with 1 df has a probability between 0.01 and 0.001. The conclusion is that the observed genotype frequencies would be observed less than 1% of the time in a population that actually had Hardy–Weinberg expected genotype frequencies. Under the null hypothesis, we do not expect this much difference or more from Hardy–Weinberg expectations to occur often. By convention, we would reject chance as the explanation for the differences if the χ 2value had a probability of 0.05 or less. In other words, if chance explains the difference in five trials out of 100 or less, then we reject the hypothesis that the observed and expected patterns are the same. The critical value above which we reject the null hypothesis for a χ 2test is 3.84 with 1 df, or in notation χ 2 0.05, 1= 3.84. In this case, we can clearly see an excess of heterozygotes and deficits of homozygotes, and employing the χ 2test allows us to conclude that Hardy–Weinberg expected genotype frequencies are not present in the population.
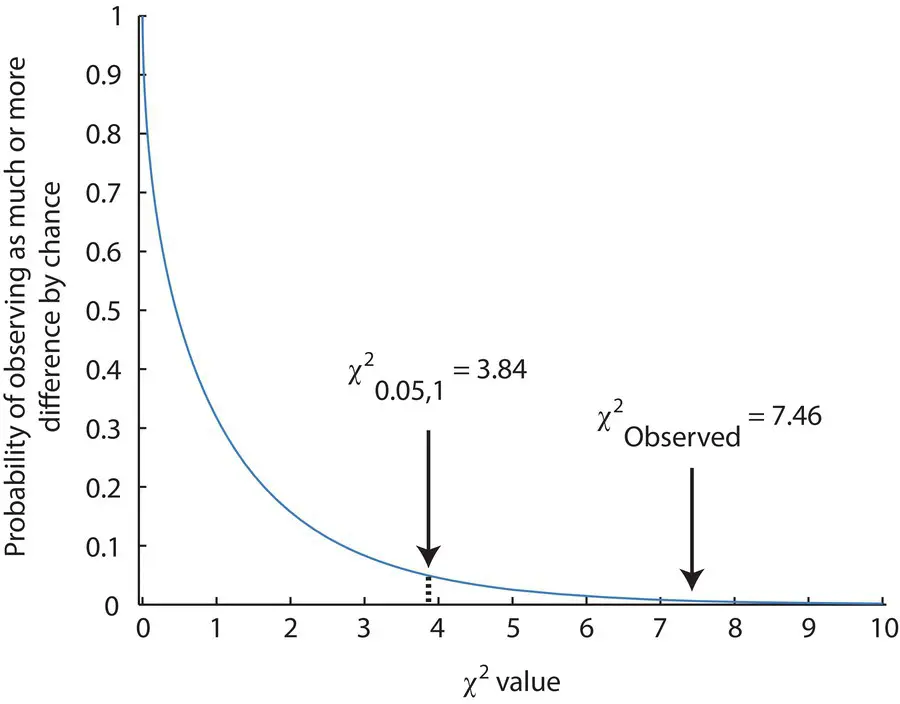
Figure 2.9 A χ 2distribution with one degree of freedom. The χ 2value for the Hardy–Weinberg test with MN blood group genotypes as well as the critical value to reject the null hypothesis are shown. The area under the curve to the right of the arrow indicates the probability of observing that much or more difference between the observed and expected outcomes.
Table 2.5 χ 2values and associated cumulative probabilities in the right‐hand tail of the distribution for one through five degrees of freedom.
Читать дальшеИнтервал:
Закладка:
Похожие книги на «Population Genetics»
Представляем Вашему вниманию похожие книги на «Population Genetics» списком для выбора. Мы отобрали схожую по названию и смыслу литературу в надежде предоставить читателям больше вариантов отыскать новые, интересные, ещё непрочитанные произведения.


Обсуждение, отзывы о книге «Population Genetics» и просто собственные мнения читателей. Оставьте ваши комментарии, напишите, что Вы думаете о произведении, его смысле или главных героях. Укажите что конкретно понравилось, а что нет, и почему Вы так считаете.