Denis Mercier - Spatial Impacts of Climate Change
Здесь есть возможность читать онлайн «Denis Mercier - Spatial Impacts of Climate Change» — ознакомительный отрывок электронной книги совершенно бесплатно, а после прочтения отрывка купить полную версию. В некоторых случаях можно слушать аудио, скачать через торрент в формате fb2 и присутствует краткое содержание. Жанр: unrecognised, на английском языке. Описание произведения, (предисловие) а так же отзывы посетителей доступны на портале библиотеки ЛибКат.
- Название:Spatial Impacts of Climate Change
- Автор:
- Жанр:
- Год:неизвестен
- ISBN:нет данных
- Рейтинг книги:5 / 5. Голосов: 1
-
Избранное:Добавить в избранное
- Отзывы:
-
Ваша оценка:
Spatial Impacts of Climate Change: краткое содержание, описание и аннотация
Предлагаем к чтению аннотацию, описание, краткое содержание или предисловие (зависит от того, что написал сам автор книги «Spatial Impacts of Climate Change»). Если вы не нашли необходимую информацию о книге — напишите в комментариях, мы постараемся отыскать её.
Spatial Impacts of Climate Change — читать онлайн ознакомительный отрывок
Ниже представлен текст книги, разбитый по страницам. Система сохранения места последней прочитанной страницы, позволяет с удобством читать онлайн бесплатно книгу «Spatial Impacts of Climate Change», без необходимости каждый раз заново искать на чём Вы остановились. Поставьте закладку, и сможете в любой момент перейти на страницу, на которой закончили чтение.
Интервал:
Закладка:
1.5.3. Volcanism
Major volcanic eruptions can inject huge amounts of gases into the stratosphere, including carbon dioxide Co 2, sulfur dioxide So 2or hydrogen sulfides H 2S. Sulfur gases (So 2and H 2S) lead to the formation of liquid sulfate aerosols in the stratosphere with a lifetime of a few years. These aerosols scatter incoming solar radiation and absorb infrared radiation. They then lead to a clear reduction in the radiation reaching the earth's surface and thus induce cooling.
Major periods of volcanic activity in the Earth's geological past, such as the one that allowed the Deccan traps in India to form, have resulted in climatic changes that have caused major environmental crises, such as the most famous mass extinction of the late Cretaceous period, 65 million years ago, which contributed to the extinction of the dinosaurs. The multi-millennia history of societies also includes a number of volcanic eruptions that have modified the climate, with repercussions at different scalar levels: climatic, agricultural, sanitary, demographic and political (Eldgja in 939-940, Samalas in 1257, Laki in 1783, Tambora in 1815, Krakatoa in 1883). Two major volcanic eruptions in 536 and 540, the names of the active volcanoes involved are still not known with certainty, are believed to have caused a 2°C drop in temperature in the northern hemisphere during the decade 536-545. A positive feedback loop of spatial extension of the Arctic ice pack would thus have amplified volcanic-induced atmospheric cooling by the combined increase in albedo and reduced ocean-atmosphere interactions (Toohey et al . 2016).
Reconstructions of summer temperatures for the Northern Hemisphere can be made for the last 1500 years based on tree ring widths and maximum wood density. For the Samalas eruptions of 1257, the summer cooling is estimated to have been -1.3°C for the extra-tropical regions of the Northern Hemisphere and -0.8°C for the Tambora eruption in 1815. These coolings continued 4-5 years after the Samalas eruption and 2-3 years after the Tambora eruption (Stoffel et al . 2015). Analyses based on glacial records from Greenland and Antarctica since 500 BC show that the 20th Century, even though it saw major eruptions such as the Bezymianny in Kamchatka in 1955, the Agung in Bali in 1963 or Mount St. Helens in the USA in 1980, did not experience as much volcanic forcing as in previous centuries (Toohey et al . 2017).
Thus, the thermal variations over the last millennium (medieval optimum and Little Ice Age) could be explained by a combination of natural climate forcings, linked in particular to variations in solar activity and volcanic activity (Khodri et al . 2015). on the other hand, simulations of future climate change for the 21st Century generally do not take into account likely major volcanic eruptions. one study, however, attempts to model how 60 eruptions could influence climate change by 2100 and concludes that, beyond annual or decadal variability, they are unlikely to be able to mitigate contemporary climate warming on this secular scale (Bethke et al . 2017).
1.5.4. Albedo and the radiation balance
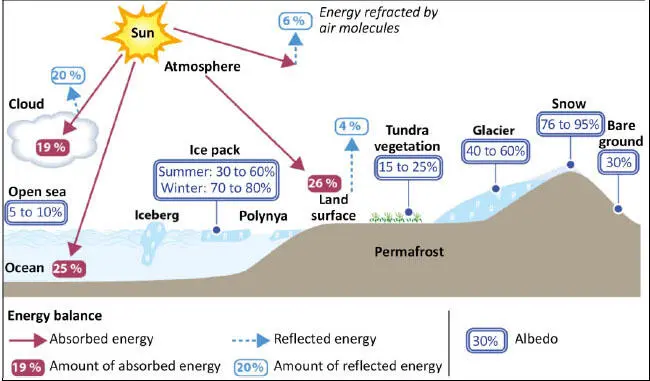
Figure 1.12. Elements of the global energy balance and albedo of different surfaces in the Arctic
(source: design D. Mercier, drawing by F. Bonnaud, Faculty of Arts, Sorbonne University, 2020). For a color version of this figure, see www.iste.co.uk/mercier/climate.zip
Although albedo occurs everywhere on the planet's surface, its role in today's global warming is best illustrated in the Arctic basin. The ocean (sea ice) and land (glaciers, snow) surfaces of the Arctic cryosphere have a high albedo potential (see Figure 1.12). Increases in air and ocean temperatures are contributing to a decrease in the spatial extent of the cryosphere (see Chapter 2).
Thus, while changes in sea ice and snow cover can be considered as impacts of climate change, the role of these changes in the albedo-temperature feedback also makes them agents of change, through a positive feedback loop (see Figure 1.13). As temperature increases, surfaces with low albedo powers (ice-free ocean and land surface devoid of glaciers and snow) increase and absorb more solar radiation and become warmer.
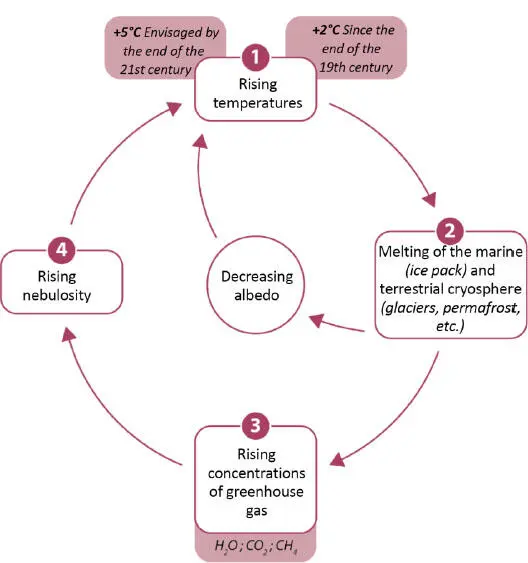
Figure 1.13. Positive feedback loops explaining the amplification of Arctic climate warming
(source: design D. Mercier, drawing by F. Bonnaud, Faculty of Arts, Sorbonne University, 2020). For a color version of this figure, see www.iste.co.uk/mercier/climate.zip
In addition to albedo, Figure 1.12 illustrates the major components of the Earth's radiation budget, which is simplified by an average solar energy input of 342 watts per square meter to the Earth's surface. The percentages of each component (clouds, ocean, land surface, atmosphere) show that only 47% is absorbed (25% by the oceans and 22% by land surfaces). In the evolution of temperature in the lower layers of the atmosphere, the cloud component plays a fundamental role because it absorbs part of the energy (19%) and reflects 20%. Cloud cover and its temporal evolution therefore appear to be an essential element in understanding the evolution of the radiation balance on the Earth's surface.
1.6. Conclusion
Contemporary climate change is illustrated by recognized and measured thermal and rainfall trends that are neither linear over time nor spatially uniform. Beyond the general logics of the physical laws governing the climate machine on a global scale (radiation balance, importance of astronomical parameters, role of greenhouse gases and volcanism, thermal gradients, air humidity capacity, etc.), regional and local nuances illustrate the importance of geographical factors and interactions between all components, such as the fundamental Arctic-wide interaction between the ocean, sea ice and the atmosphere. Whether during the cold Pleistocene sequences or during contemporary global warming, we are seeing an amplification of changes in high-latitude environments, particularly in the Arctic Basin.
1.7. References
AMAP (2017). Snow, Water, Ice and Permafrost in the Arctic (SWIPA) . Arctic Monitoring and Assessment Programme (AMAP), Oslo.
Bethke, I., Outten, S., Ottera, O.H., Hawkins, E., Wagner, S., Sigl, M., Thorne, P. (2017). Potential volcanic impacts on future climate variability. Nature Climate Change , 7(11), 799-805.
Bourriquen, M., Mercier, D., Baltzer, A., Fournier, J., Costa, S., Roussel, E. (2018). Paraglacial coasts responses to glacier retreat and associated shifts in river floodplains over decadal timescales (1966-2016), Kongsfjorden, Svalbard. Land Degradation and Development , 29(11), 4173-4185.
Cheng, L., Abraham, J., Zhu, J., Trenberth, K.E., Fasullo, J., Boyer, T., Locarnini, R., Zhang, B., Yu, F., Wan, L., Chen, X., Song, X., Liu, Y., Mann, M.E. (2020). Record-setting ocean warmth continued in 2019. Advances in Atmospheric Sciences , 37, 137-142.
Forland, E.J., Benestad, R., Hanssen-Bauer, I., Haugen, J.E., Skaugen, T.E. (2012). Temperature and precipitation development at Svalbard 1900-2100. Advances in Meteorology , 2011(17).
Hanssen-Bauer, I., Forland, E.J., Hisdal, H., Mayer, S., Sand0, A.B., Sorteberg, A. (2019). Climate in Svalbard 2100 - A knowledge base for climate adaptation . Report, 1/2019, NCCS.
Читать дальшеИнтервал:
Закладка:
Похожие книги на «Spatial Impacts of Climate Change»
Представляем Вашему вниманию похожие книги на «Spatial Impacts of Climate Change» списком для выбора. Мы отобрали схожую по названию и смыслу литературу в надежде предоставить читателям больше вариантов отыскать новые, интересные, ещё непрочитанные произведения.


Обсуждение, отзывы о книге «Spatial Impacts of Climate Change» и просто собственные мнения читателей. Оставьте ваши комментарии, напишите, что Вы думаете о произведении, его смысле или главных героях. Укажите что конкретно понравилось, а что нет, и почему Вы так считаете.