Denis Mercier - Spatial Impacts of Climate Change
Здесь есть возможность читать онлайн «Denis Mercier - Spatial Impacts of Climate Change» — ознакомительный отрывок электронной книги совершенно бесплатно, а после прочтения отрывка купить полную версию. В некоторых случаях можно слушать аудио, скачать через торрент в формате fb2 и присутствует краткое содержание. Жанр: unrecognised, на английском языке. Описание произведения, (предисловие) а так же отзывы посетителей доступны на портале библиотеки ЛибКат.
- Название:Spatial Impacts of Climate Change
- Автор:
- Жанр:
- Год:неизвестен
- ISBN:нет данных
- Рейтинг книги:5 / 5. Голосов: 1
-
Избранное:Добавить в избранное
- Отзывы:
-
Ваша оценка:
Spatial Impacts of Climate Change: краткое содержание, описание и аннотация
Предлагаем к чтению аннотацию, описание, краткое содержание или предисловие (зависит от того, что написал сам автор книги «Spatial Impacts of Climate Change»). Если вы не нашли необходимую информацию о книге — напишите в комментариях, мы постараемся отыскать её.
Spatial Impacts of Climate Change — читать онлайн ознакомительный отрывок
Ниже представлен текст книги, разбитый по страницам. Система сохранения места последней прочитанной страницы, позволяет с удобством читать онлайн бесплатно книгу «Spatial Impacts of Climate Change», без необходимости каждый раз заново искать на чём Вы остановились. Поставьте закладку, и сможете в любой момент перейти на страницу, на которой закончили чтение.
Интервал:
Закладка:
Maps of climate change projected to the end of the 21st Century show that the continents and the Arctic basin are most affected by this warming under any scenario with an increase of 2.6 watts per square meter (RCP2.6), accentuated by an increase of 8.5 watts per square meter (RCP8.5). For the amount of average annual precipitation considered by 2100, the maps show that the cold regions of the Arctic and Antarctic should logically receive more water in relation to a higher moisture content of the air in these cold regions associated with the increase in the evaporation potential over the Arctic basin with less ice pack in summer.
On the other hand, regarding land masses, it is mainly the Mediterranean regions and certain regions of South America and South Africa that would experience a decrease in rainfall, which would have a significant impact on agricultural yields (see Chapter 10).
1.4. Future Arctic-wide climate change
The polar projections in Figures 1.10 and 1.11provide a better understanding of the magnitude of the projected warming in the Arctic Basin by 2050 and 2100 for summer (June to August) and winter (December to February), regardless of the scenario selected, RCP4.5 or RCP8.5. For the summer months, the continental regions surrounding the Arctic Basin would warm up the most.
On the other hand, the magnitude of warming would be exacerbated over the marine areas of the Arctic Basin during the winter months. Indeed, as the melting of the summer ice pack increased in summer during the 21st Century, the thermal inertia of the oceans, which accumulate more heat in summer through solar radiation, also makes it possible to halt the spatial expansion of sea ice in the winter period, even though winter temperatures continue to be favorable to its formation.
This amplifying role of the oceans shows what is at stake in the interactions between the atmosphere and the hydrosphere, with or without the central role of the sea ice filter.
For example, the average winter temperature in the Longyearbyen region of Svalbard at the end of the 21st Century is expected to be about 10°C higher than the current climate (F0rland et al . 2012).
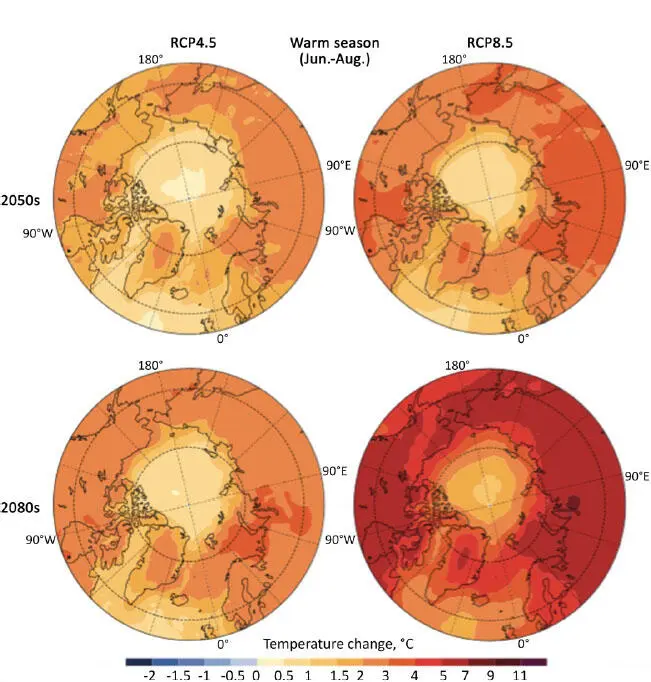
Figure 1.10. Projected changes in summer surface temperatures (June to August) compared to the 1986-2005 average under scenario 4.5 and 8.5, for the years 2050 and 2080
(source: AMAP 2017). For a color version of this figure, see www.iste.co.uk/mercier/climate.zip
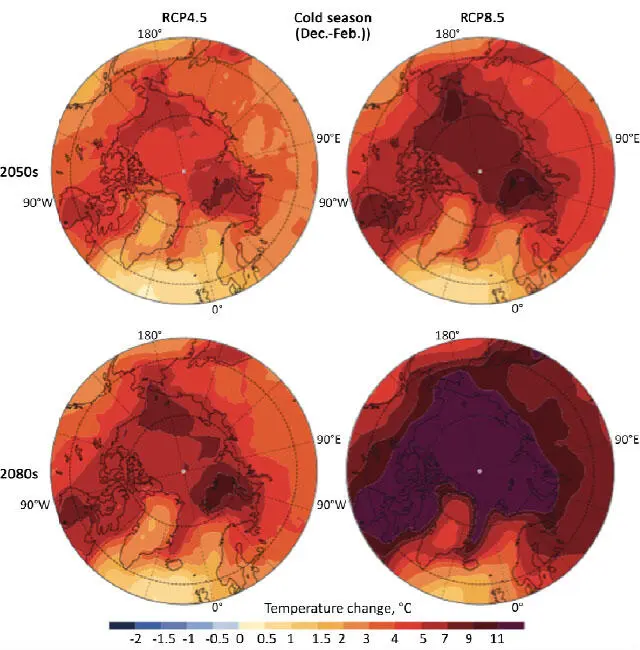
Figure 1.11. Projected changes in winter (December to February) surface temperatures relative to the 1986-2005 average under scenarios 4.5 and 8.5, for the years 2050 and 2080
(source: AMAP 2017). For a color version of this figure, see www.iste.co.uk/mercier/climate.zip
1.5. The causes of climate change
1.5.1. Solar radiation
Depending on the time scales considered, orbital variations concerning the Earth and the sun play a fundamental role in understanding climate change. Thus, the astronomical cycles (eccentricity, obliquity and precession) highlighted by Milutin Milanković allow us to understand the large climatic oscillations between long cold sequences separated by shorter interglacial periods. The change in global average surface temperature between the last glacial maximum (21,000 years ago) and the pre-industrial climate is estimated to be about 5°C (between 3 and 8°C). It would have been a few degrees in the tropics and 10°C at the poles (Masson-Delmotte et al. 2015). During the Eemian interglacial period (128,000 to 116,000 years ago), estimated temperatures were 3 to 5°C higher than in the pre-industrial period, resulting in the melting of a significant fraction of the cryosphere and a sea level rise of about 6.6 to 9.4 m above the present level (Lageat 2019).
On another time scale, it has been shown that solar radiation varies in intensity with minimums, such as the Maunder minimum in the 17th Century or the Dalton minimum from 1800 to 1830. The latter corresponds to the coldest period of the Little Ice Age. At the century scale, a linear relationship between the air temperature series at the Longyearbyen station in Svalbard and the length of a solar cycle has been demonstrated (Solheim et al . 2011). Thus, the contemporary evolution of temperatures, which records sequences of warming (1910-1940 and since 1980), separated by sequences of stagnation or even slight cooling (from 1880 to 1910 and then from 1940 to 1980), could be partly explained by these variations in solar radiation intensity.
1.5.2. Anthropogenic greenhouse gas emissions
Since the beginning of the industrial revolution, the quantity of greenhouse gases (GHGs) injected into the atmosphere by human activities (CO 2, CH 4, etc.) has been considerable (see Table 1.1).
These concentrations represent a major disruption in the evolution of the climate compared to pre-industrial natural evolution. These anthropogenic gases reinforce the greenhouse effect and prevent infrared radiation from leaving the lower layers of the atmosphere, which leads to the warming of the air, surface ocean layers and soils. The increase in GHGs is mainly linked to the use of fossil fuels (coal, gas and oil). However, agriculture also contributes to this increase, in particular through deforestation, which is partly responsible for the emission of carbon dioxide (CO 2), rice growing and the breeding of ruminants that release methane (CH 4), and pig farming and the spreading of manure as fertilizer, which is responsible for the increase in nitrous oxides (N 2O). These changes are intimately linked to changes in consumption patterns and to the evolution of the world population explosion since the 19th Century, unprecedented in the history of mankind.
Table 1.1. Global annual average surface area abundances and trends of the main greenhouse gases of the Global Atmosphere Watch (GAW) of the World Meteorological Organization (WMO) Global Atmosphere Watch (GAW) global greenhouse gas (GHG) monitoring network
| CO2 | ch4 | N2O | |
| Average overall abundance in 2018 | 407.8 ± 0.1 ppm | 1,869 ± 2 ppb | 331.1 ± 0.1 ppb |
| Average overall abundance in 1750 | 278 ppm | 722 ppb | 270 ppb |
| Relative abundance in 2018 compared to 1750 | + 147% | + 259% | + 123% |
| Absolute increase between 2017 and 2018 | 2.3 ppm | 10 ppb | 1.2 ppb |
| Relative increase between 2017 and 2018 | + 0.57% | + 0.54% | + 0.36% |
| Annual average of absolute growth over the last 10 years | + 2.26 ppm per year | + 7.1 ppb per year | + 0.95 ppb per year |
COMMENT ON TABLE 1.1.- Units are molecular fractions of dry air and uncertainties are 68% confidence limits. A number of stations are used for the analyses: 129 for CO2, 127 for CH4 and 96 for N2O (source: WMO 2019) .
The most optimistic scenarios of global warming are based on a decrease or stabilization of GHG emissions. However, if we look lucidly at the consumption trajectories of contemporary societies, the most pessimistic scenarios remain the most likely. In order to achieve a neutralization of Co 2emissions, the necessary changes in energy consumption, transportation, industrial production, agricultural production linked to changes in food consumption, societal choices and therefore political choices are radical and therefore unlikely in the short term, even though many solutions exist.
Читать дальшеИнтервал:
Закладка:
Похожие книги на «Spatial Impacts of Climate Change»
Представляем Вашему вниманию похожие книги на «Spatial Impacts of Climate Change» списком для выбора. Мы отобрали схожую по названию и смыслу литературу в надежде предоставить читателям больше вариантов отыскать новые, интересные, ещё непрочитанные произведения.


Обсуждение, отзывы о книге «Spatial Impacts of Climate Change» и просто собственные мнения читателей. Оставьте ваши комментарии, напишите, что Вы думаете о произведении, его смысле или главных героях. Укажите что конкретно понравилось, а что нет, и почему Вы так считаете.