Denis Mercier - Spatial Impacts of Climate Change
Здесь есть возможность читать онлайн «Denis Mercier - Spatial Impacts of Climate Change» — ознакомительный отрывок электронной книги совершенно бесплатно, а после прочтения отрывка купить полную версию. В некоторых случаях можно слушать аудио, скачать через торрент в формате fb2 и присутствует краткое содержание. Жанр: unrecognised, на английском языке. Описание произведения, (предисловие) а так же отзывы посетителей доступны на портале библиотеки ЛибКат.
- Название:Spatial Impacts of Climate Change
- Автор:
- Жанр:
- Год:неизвестен
- ISBN:нет данных
- Рейтинг книги:5 / 5. Голосов: 1
-
Избранное:Добавить в избранное
- Отзывы:
-
Ваша оценка:
Spatial Impacts of Climate Change: краткое содержание, описание и аннотация
Предлагаем к чтению аннотацию, описание, краткое содержание или предисловие (зависит от того, что написал сам автор книги «Spatial Impacts of Climate Change»). Если вы не нашли необходимую информацию о книге — напишите в комментариях, мы постараемся отыскать её.
Spatial Impacts of Climate Change — читать онлайн ознакомительный отрывок
Ниже представлен текст книги, разбитый по страницам. Система сохранения места последней прочитанной страницы, позволяет с удобством читать онлайн бесплатно книгу «Spatial Impacts of Climate Change», без необходимости каждый раз заново искать на чём Вы остановились. Поставьте закладку, и сможете в любой момент перейти на страницу, на которой закончили чтение.
Интервал:
Закладка:
2.3. Melting of the marine cryosphere
2.3.1. The melting of the Arctic sea ice
Between 1979 and 2019, the Arctic sea ice lost 12.9% of its surface area per decade, representing a loss of half of its surface area by the end of the melt season (see Figure 2.2). As a result, in September 2019, Arctic sea ice occupied just over 4 million km 2, compared to almost 8 million km 2in 1979. This trend represented a loss of 82,400 km 2per year between 1979 and 2019. Beyond this four-decade trend,
Figure 2.2 shows that the melting of the sea ice has in fact slowed over the last 13 years (2007-2019).
The year 2012 corresponds to the year when the reduction in the ocean surface area covered by Arctic sea ice was the most marked in the last 40 years (see Figures 2.2and 2.3). It was mainly visible along the Siberian coast, clearing the Northeast Passage. Similarly, the sea ice disappeared from the Beaufort Sea along the coasts of Canada and northern Alaska in the summer of 2012. Sea ice still occupies the oceanic part between the North Pole, northern Greenland and Ellesmere Island, for atmospheric and oceanic reasons related to the Beaufort Gyre. This spatial asymmetry in the extension of the Arctic sea ice is increasing with contemporary global warming.
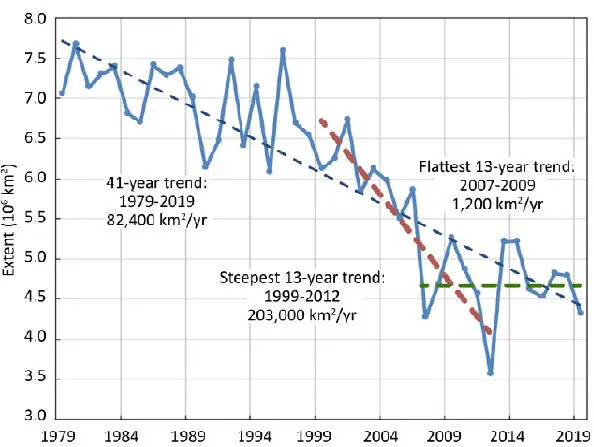
Figure 2.2. Average Arctic sea ice extent for the month of September between 1979 and 2019. Decade of decline of 12.9%. For a color version of this figure, see www.iste.co.uk/mercier/climate.zip
(source: National Snow and Ice Data Center).
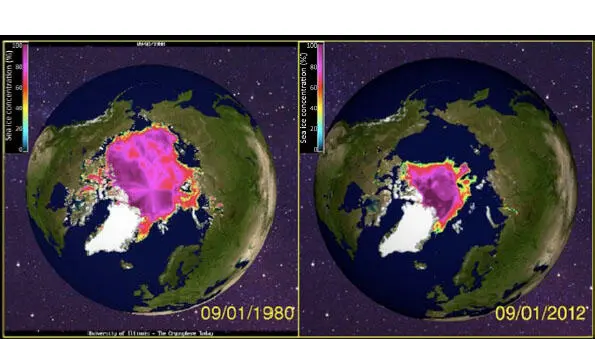
Figure 2.3. Spatial extent of Arctic sea ice as of September 1, 1980, and on September 1, 2012, the year in which the extension was the least in the last four decades. For a color version of this figure, see www.iste.co.uk/mercier/climate.zip
(source: The Cryosphere Today)
In addition to the loss of surface area, the average thickness of the Arctic sea ice has decreased by half, from 3 m to 1.5 m. This is due to the spatial reduction of multi-year sea ice in favor of the young annual sea ice (AMAP 2017). Thus, the younger, thinner Arctic sea ice is also more fragile, more brittle, and more easily displaced from the Arctic Basin via Fram Strait by transpolar drift (see Figure 2.4). This positive feedback loop helps to understand the evolutionary process of this reduction in the spatial extent of Arctic sea ice (Weiss 2008). According to the latest IPCC report (IPCC 2019), the proportion of multi-year ice that is at least five years old decreased by about 90% between 1979 and 2018.
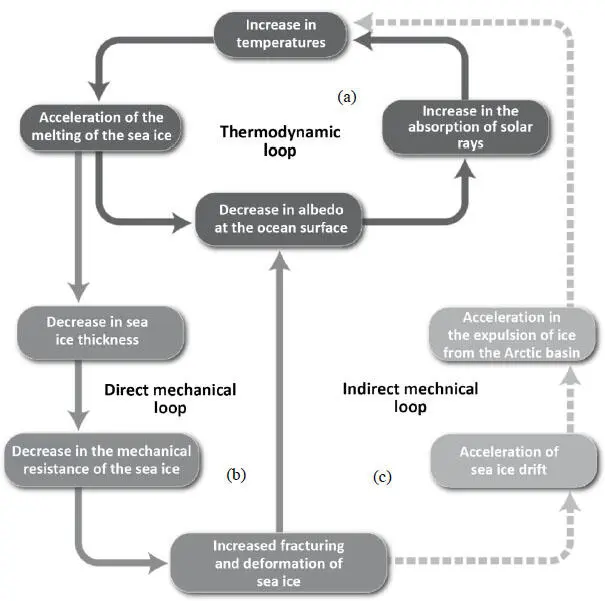
Figure 2.4.(a) Thermodynamic feedback loops; (b) direct mechanics; and (c) indirect mechanics, all explaining the melting of the Arctic sea ice. For a color version of this figure, see www.iste.co.uk/mercier/climate.zip
(source: modified from Weiss 2008)
2.3.2. Antarctic sea ice
On the other hand, the dynamics and evolution of the sea ice surrounding the Antarctic continent are of a different nature.
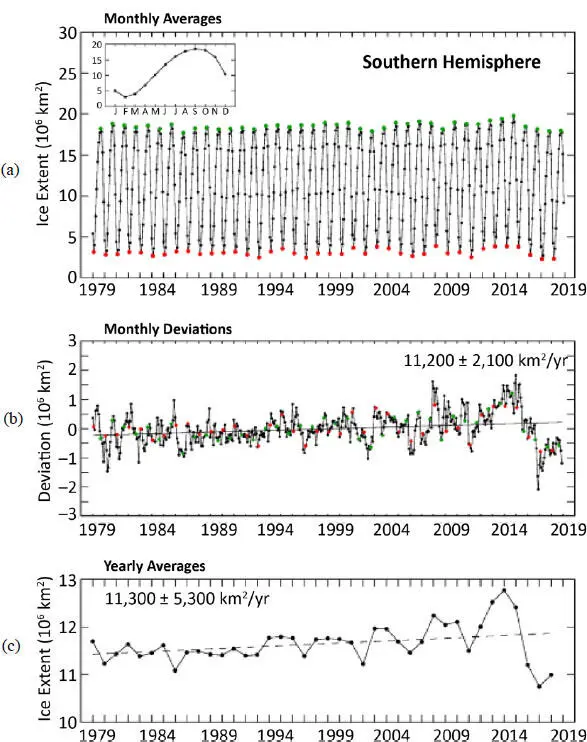
Figure 2.5. Antarctic sea ice extents derived from satellite data DMSP Nimbus7 and NASA. For a color version of this figure, see www.iste.co.uk/mercier/climate.zip
(source: Parkinson 2019)
COMMENT ON FIGURE 2.5.- (a) Mean monthly sea ice extent for the southern hemisphere from January 1979 to December 2018. The February ranges are shown in red, the September ranges in green and all other ranges in black. (Box) The 40-year average annual cycle. (b) Monthly deviations determined from the monthly mean data of (a), with the same monthly color coding and with the line of least squares. (c) Mean annual sea ice extent and trend .
The spatial extension of the Antarctic sea ice is symmetrical around the continent from the South Pole and reveals a double spatial astronomical and therefore thermal logic. In addition, sea currents and winds circulate continuously around the continent in an hourly direction. They then act as a thermal barrier surrounding the continent. Unlike the Arctic Basin, the absence of a land boundary around the continent allows Antarctic sea ice to float freely towards mid-latitudes where warmer waters cause it to melt. As a result, most of the sea ice that forms during the southern winter melts during the summer season. During the winter, the Antarctic sea ice reached an average of 18 million km 2between 1981 and 2010 with a maximum extension in September. In September 2014, it even reached 20 million km 2. Its minimum extension was still registered in February with less than 5 million km 2(see Figure 2.5; NSIDC 2019; Parkinson 2019).
Since record levels in 2014 and despite the significant declines in recent years in the spatial extent of the Antarctic sea ice, the trend for the period 1979-2018 still remains positive with an increase of 11,300 km 2per year (Parkinson 2019). The causes of this increase in the spatial extent of the Antarctic sea ice have not yet been agreed (Parkinson 2019). On the other hand, the impact of this variability in the extension of the sea ice around Antarctica determines the extent of pre-precipitation for the continent. Between a reduced extension and a vast extension of the sea ice, the difference in precipitation is estimated at 102 Gt per year (Wang et al . 2020).
2.4. Melting of the Earth's cryosphere
2.4.1. Melting ice sheets
2.4.1.1. The melting of Greenland
Between 2006 and 2015, the Greenland ice sheet lost ice mass at an average rate of 278 ± 11 billion tons per year (IPCC 2019). This melting represents an equivalent of 0.77 ± 0.03 mm per year in global sea level rise. Melting mainly affects the surface of the ice sheet (see Figures 2.6 and 2.7).
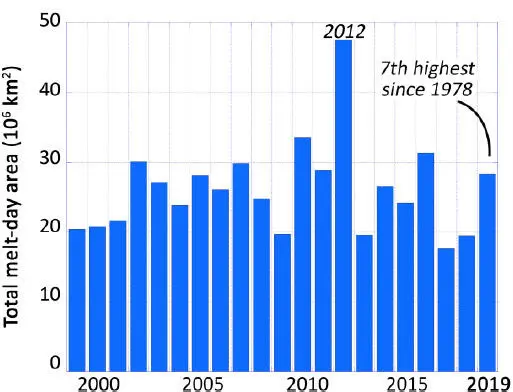
Figure 2.6. Total extent of melt day, or sum of daily melt area during the 1999-2019 melt season in Greenland. For a color version of this figure, see www.iste.co.uk/mercier/climate.zip
(source: NSIDC)
Since 2000, the Greenland ice sheet has experienced a general increase in melting, with a melt day area for 2019 totaling 28.3 million square kilometers. Melting has been observed over nearly 90% of the island on at least one day, even reaching the Summit station and much of the high-altitude areas. It was particularly intense along the northern edge of the ice cap, where, compared to the average from 1981 to 2010, melting occurred on an additional 35 days. The number of melt days was also slightly above average along the western flank of the ice cap, with about 15 to 20 more melt days than average. In the south and southeast, the melt was slightly below average within a few days.
This melting is caused by warm, moist air flows associated with active summer and winter cyclogenesis, from the south or southeast. These mechanisms result in increased cloud cover, low-level liquid and snowy precipitation at high elevations in the ice sheet, better absorption of long-wave radiation, and a decrease in albedo in the south and near the coast, accelerating the melting of the snowpack (Oltmanns et al . 2019).
Читать дальшеИнтервал:
Закладка:
Похожие книги на «Spatial Impacts of Climate Change»
Представляем Вашему вниманию похожие книги на «Spatial Impacts of Climate Change» списком для выбора. Мы отобрали схожую по названию и смыслу литературу в надежде предоставить читателям больше вариантов отыскать новые, интересные, ещё непрочитанные произведения.


Обсуждение, отзывы о книге «Spatial Impacts of Climate Change» и просто собственные мнения читателей. Оставьте ваши комментарии, напишите, что Вы думаете о произведении, его смысле или главных героях. Укажите что конкретно понравилось, а что нет, и почему Вы так считаете.