Denis Mercier - Spatial Impacts of Climate Change
Здесь есть возможность читать онлайн «Denis Mercier - Spatial Impacts of Climate Change» — ознакомительный отрывок электронной книги совершенно бесплатно, а после прочтения отрывка купить полную версию. В некоторых случаях можно слушать аудио, скачать через торрент в формате fb2 и присутствует краткое содержание. Жанр: unrecognised, на английском языке. Описание произведения, (предисловие) а так же отзывы посетителей доступны на портале библиотеки ЛибКат.
- Название:Spatial Impacts of Climate Change
- Автор:
- Жанр:
- Год:неизвестен
- ISBN:нет данных
- Рейтинг книги:5 / 5. Голосов: 1
-
Избранное:Добавить в избранное
- Отзывы:
-
Ваша оценка:
Spatial Impacts of Climate Change: краткое содержание, описание и аннотация
Предлагаем к чтению аннотацию, описание, краткое содержание или предисловие (зависит от того, что написал сам автор книги «Spatial Impacts of Climate Change»). Если вы не нашли необходимую информацию о книге — напишите в комментариях, мы постараемся отыскать её.
Spatial Impacts of Climate Change — читать онлайн ознакомительный отрывок
Ниже представлен текст книги, разбитый по страницам. Система сохранения места последней прочитанной страницы, позволяет с удобством читать онлайн бесплатно книгу «Spatial Impacts of Climate Change», без необходимости каждый раз заново искать на чём Вы остановились. Поставьте закладку, и сможете в любой момент перейти на страницу, на которой закончили чтение.
Интервал:
Закладка:
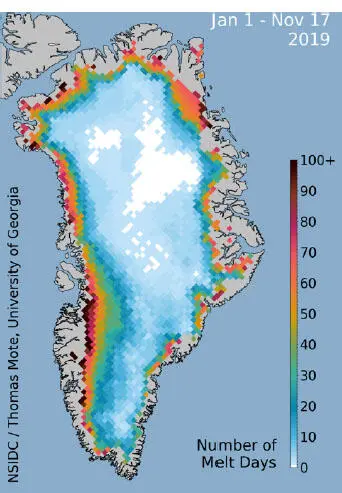
Figure 2.7. Number of days of melt at the surface of Greenland's ice sheet between January 1 and November 17, 2019. For a color version of this figure, see www.iste.co.uk/mercier/climate.zip
(source: NSIDC, Thomas Mote, University of Georgia)
2.4.1.2. The melting of the Antarctic
Between 2006 and 2015, the Antarctic ice sheet lost ice mass at an average rate of 155 ± 19 Gt per year (0.43 ± 0.05 mm per year), mainly due to the rapid thinning and retreat of large glaciers downstream of the continent draining the West Antarctic ice sheet, especially in the Amundsen Sea and Wilkes Land in the eastern part (IPCC 2019).
The total mass loss of the Antarctic ice sheet is increasing every decade. It increased from 40 ± 9 Gt per year in 1979-1990 to 50 ± 14 Gt per year in 1989-2000, 166 ± 18 Gt per year in 1999-2009 and 252 ± 26 Gt per year in 2009-2017 (Rignot et al. 2019; see Figure 2.8).
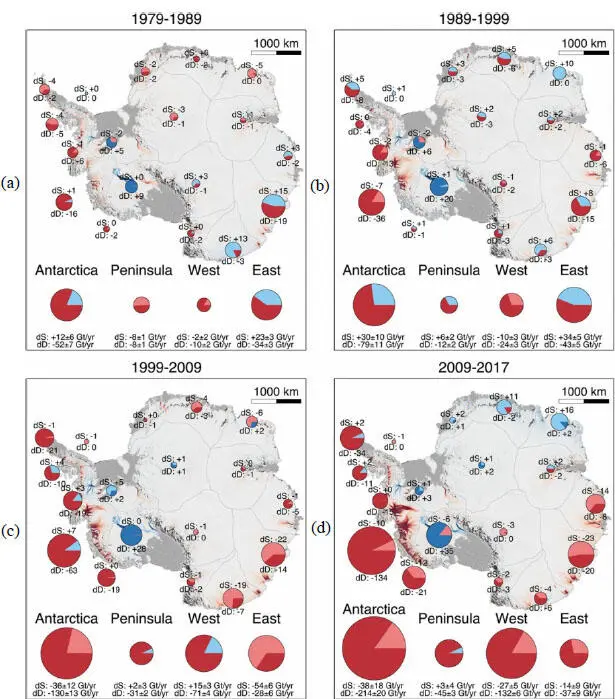
Figure 2.8. Mass balance of the Antarctic ice sheet. For a color version of this figure, see www.iste.co.uk/mercier/climate.zip
COMMENT ON FIGURE 2.8.- The size of the circle is proportional to the absolute magnitude of the anomaly in D (dD = SMB1979-2008 - D) or SMB (dSMB = SMB - SMB1979-2008). The color of the circle indicates a loss in dD (dark red) or dSMB (light red) relative to a gain in dD (dark blue) or dSMB (light blue) in billions of tons (1,012 kg) per year. The dark color refers to dD; the light color refers to dSMB. The graphs show totals for Antarctica, Antarctic Peninsula, West Antarctica and East Antarctica. The bottom is the total mass balance distributed over the catchments with a color code ranging from red (loss) to blue (gain) (source: Rignot et al. 2019) .
Between 2009 and 2017, mass loss was dominated by the Amundsen and Bellingshausen Sea sectors in West Antarctica (159 ± 8 Gt per year), Wilkes Land in East Antarctica (51 ± 13 Gt per year), and the Western and Northeastern Peninsula (42 ± 5 Gt per year). The contribution to sea level rise from Antarctica averaged 3.6 ± 0.5 mm per decade with a cumulative 14.0 ± 2.0 mm since 1979, of which 6.9 ± 0.6 mm from West Antarctica, 4.4 ± 0.9 mm from East Antarctica and 2.5 ± 0.4 mm from the Peninsula (i.e. East Antarctica is a major contributor to mass loss). Throughout the period, the mass loss was concentrated in the closest to deep circumpolar water (DCW) that is warm, salty, subterranean, which is consistent with the enhanced polar winds pushing DCW towards Antarctica to melt its floating ice shelves, destabilize glaciers and raise sea level (Rignot et al. 2019).
2.4.2. The melting of mountain glaciers
The World Glacier Monitoring Service (WGMS) provides standardized statistical data, such as ice front variations and mass balances 1.
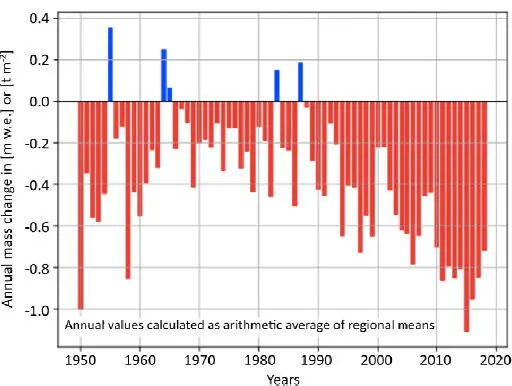
Figure 2.9. Annual mass balance of reference glaciers with more than 30 years of glaciological measurements from 1950 to 2018. The values of annual mass change are given on the y-axis in water equivalent (w.e.) per meter of water, which corresponds to tons per square meter (t/m 2). For a color version of this figure, see www.iste.co.uk/mercier/climate.zip
(source: Zemp et al. 2017)
In particular, this graph ( Figure 2.9) shows that seven of the ten most negative mass balance sheet years were recorded after 2010. A value of -1.0 m water equivalent per year represents a mass loss of 1,000 kg per square meter of ice cover or an annual loss of glacier-wide ice thickness of about 1.1 m per year, since the density of ice is only 0.9 times the density of water (Zemp et al. 2017).
Data at regional scales show that all of the world's glaciated mountain areas have been melting over the last few decades. Glaciers in North America and Central Europe are suffering the greatest losses. Between 2006 and 2015, the world's other glaciers melted at an average rate of 220 ± 30 billion tons per year, equivalent to 0.61 ± 0.08 mm per year in sea level rise (IPCC 2019).
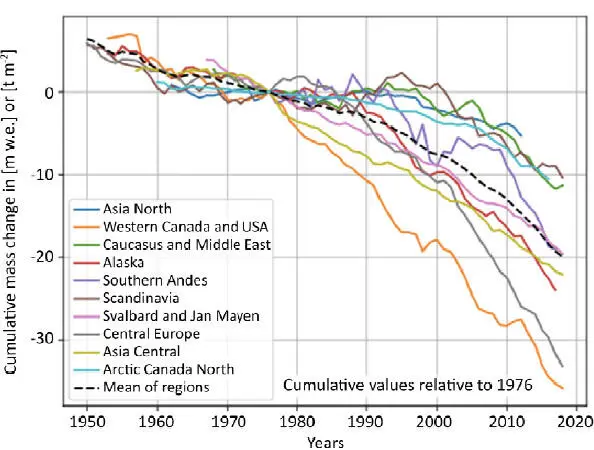
Figure 2.10. Cumulative mass change from 1976 for regional and global averages based on reference glacier data. For a color version of this figure, see www.iste.co.uk/mercier/climate.zip
(source: Zemp et al. 2017)
Recent studies are trying to determine the date of disappearance of some glaciers. For example, the evolution and characteristics such as volume, area, ice thickness, runoff and duration and mode of disappearance of glaciers have been projected for the Austre Lovénbreen glacier on the BrØgger peninsula in northwestern Spitsbergen in the Svalbard archipelago (Wang et al. 2019; see Figures 2.11and 2.12). Based on the 21st Century warming trend of the Arctic in the IPCC Fifth Assessment Report, glacier evolution was simulated under three hypothetical climate scenarios: pessimistic, high probability and optimistic. The results predicted that the glacier would retreat until it disappeared under all three scenarios, and its time to disappear would likely be about 111 years, that is by 2120.
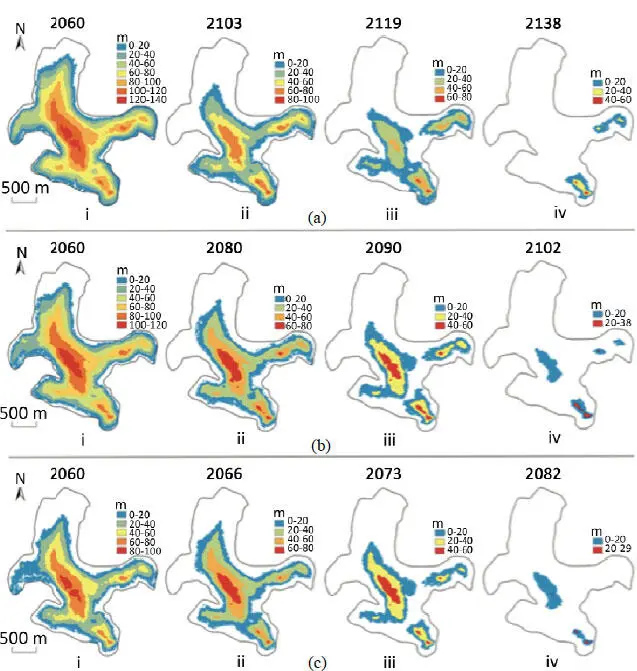
Figure 2.11. Area and thickness of the Austre Lovénbreen glacier (Svalbard) simulated for different years: (i) 50th year (2060); (ii) disappearance of the western tributary; (iii) break between the main current and the eastern tributary; (iv) late decomposition according to the scenarios (a) optimistic; (b) high probability; (c) pessimistic. For a color version of this figure, see www.iste.co.uk/mercier/climate.zip
(source: Wang et al. 2019)
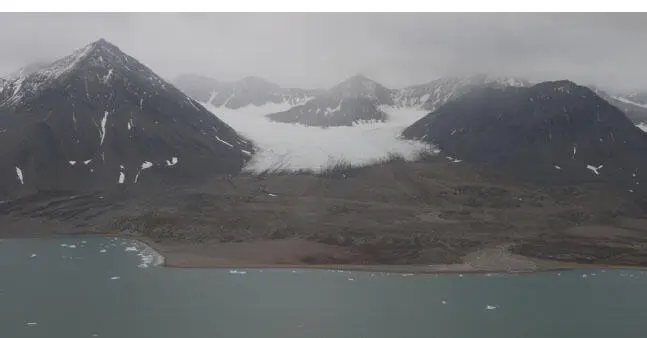
Figure 2.12. The Austre Lovenbreen glacier in northwestern Spitsbergen (Svalbard) in the background. The flat space in front of the glacier corresponds to the space freed by its melting since the beginning of the 20th Century. In the foreground, the prograding deltas on the Kongsfjorden are fed with sediments by the meltwater runoff from the glacier. For a color version of this figure, see www.iste.co.uk/mercier/climate.zip
(source: © photo by D. Mercier taken on August 24, 2017)
2.4.3. Decreasing permafrost
The IPCC Cryosphere Synthesis (IPCC 2019) provides information on the increase in permafrost temperatures since the 1980s. From 2007 to 2016, permafrost temperatures increased by an average of 0.29°C ± 0.12°C in the polar and high mountain regions of the world. The intensity of climate warming in the Arctic is exacerbated by this melting of Arctic and boreal permafrost, which may eventually release between 1,460 and 1,600 Gt of organic carbon, nearly twice the carbon in the atmosphere (IPCC 2019).
2.4.4. Melting snow
The decrease in land snow cover extent in June for the Arctic was 13.4 ± 5.4% per decade between 1967 and 2018, a total loss of approximately 2.5 million km 2, mainly due to the increase in surface air temperature (IPCC 2019).
Читать дальшеИнтервал:
Закладка:
Похожие книги на «Spatial Impacts of Climate Change»
Представляем Вашему вниманию похожие книги на «Spatial Impacts of Climate Change» списком для выбора. Мы отобрали схожую по названию и смыслу литературу в надежде предоставить читателям больше вариантов отыскать новые, интересные, ещё непрочитанные произведения.


Обсуждение, отзывы о книге «Spatial Impacts of Climate Change» и просто собственные мнения читателей. Оставьте ваши комментарии, напишите, что Вы думаете о произведении, его смысле или главных героях. Укажите что конкретно понравилось, а что нет, и почему Вы так считаете.