Thomas N. Bulkowski - Encyclopedia of Chart Patterns
Здесь есть возможность читать онлайн «Thomas N. Bulkowski - Encyclopedia of Chart Patterns» — ознакомительный отрывок электронной книги совершенно бесплатно, а после прочтения отрывка купить полную версию. В некоторых случаях можно слушать аудио, скачать через торрент в формате fb2 и присутствует краткое содержание. Жанр: unrecognised, на английском языке. Описание произведения, (предисловие) а так же отзывы посетителей доступны на портале библиотеки ЛибКат.

- Название:Encyclopedia of Chart Patterns
- Автор:
- Жанр:
- Год:неизвестен
- ISBN:нет данных
- Рейтинг книги:3 / 5. Голосов: 1
-
Избранное:Добавить в избранное
- Отзывы:
-
Ваша оценка:
Encyclopedia of Chart Patterns: краткое содержание, описание и аннотация
Предлагаем к чтению аннотацию, описание, краткое содержание или предисловие (зависит от того, что написал сам автор книги «Encyclopedia of Chart Patterns»). Если вы не нашли необходимую информацию о книге — напишите в комментариях, мы постараемся отыскать её.
, Third Edition expands upon Bulkowski's immensely popular Second Edition with fully revised and updated material on chart patterns. Whether you’re new to the stock market or an experienced professional trader, use this book as a reference guide to give you an edge.
Within the pages of this book, you’ll learn how to identify chart patterns, supported by easy-to-understand performance statistics describing how well a pattern works, what the failure rate is, and what special quirks suggest better future performance. You’ll discover how often a stop loss order will trigger at various locations within a chart pattern, how the chart pattern’s performance has evolved over the past three decades, and how to profit from failure by trading busted patterns.
This broadened and revised
offers investors the most comprehensive, up-to-date guide to this popular method of market analysis. Written by a leading expert on chart patterns, Tom Bulkowski, this edition includes revised statistics on 75 chart patterns including 23 new ones, with pictures and performance statistics, packaged within easy-to-read text.
Gain essential knowledge of chart patterns and how they are used to predict price movements in bull and bear markets New tables include how often stops are hit, busted pattern performance, performance over the decades, and special pattern features Joining Tour, Identification Guidelines, Focus on Failures, Statistics, Trading Tactics and Sample Trade is Experience. It puts you in the passenger’s seat so you can share lessons learned from Bulkowski's trades This edition reports on statistics from nearly four times the number of samples used in the Second Edition and ten times the number in the , Third Edition further solidifies the reputation of this book as the leading reference on chart patterns, setting it far above the competition.
Encyclopedia of Chart Patterns — читать онлайн ознакомительный отрывок
Ниже представлен текст книги, разбитый по страницам. Система сохранения места последней прочитанной страницы, позволяет с удобством читать онлайн бесплатно книгу «Encyclopedia of Chart Patterns», без необходимости каждый раз заново искать на чём Вы остановились. Поставьте закладку, и сможете в любой момент перейти на страницу, на которой закончили чтение.
Интервал:
Закладка:
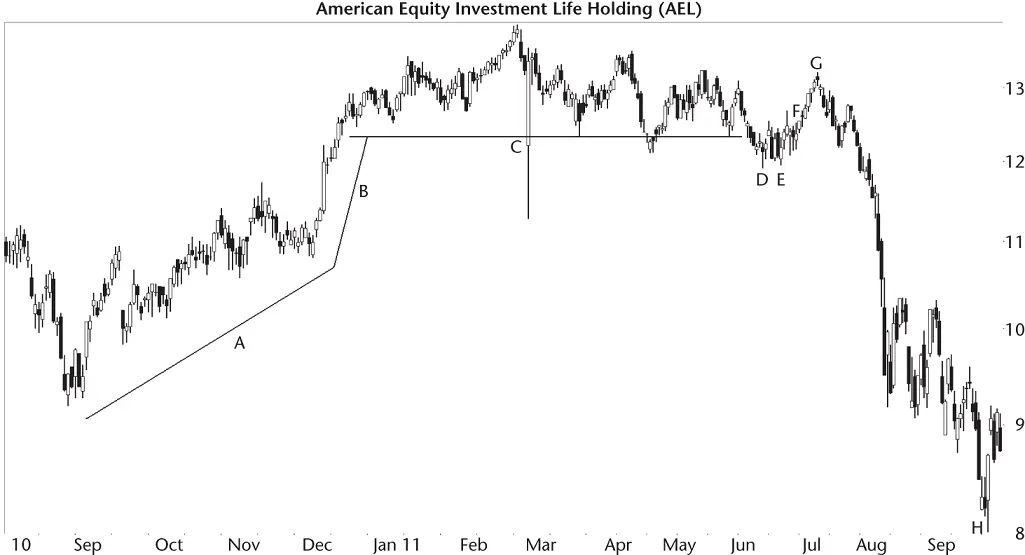
Figure 1.5 This U‐shaped pattern delivers a failure.
After the topping pattern (C), price forms a chart pattern just below the base of the peak. I show that pattern at DE (a double bottom). The double bottom confirms at F when the doji (hard to see) closes above the top of the peak between valley's D and E. Price climbs only to G before reversing.
After G, the stock drops all the way to H. Traders expecting the double bottom to deliver profits to their wallet find holes in their pockets and the money gone.
I see this setup a lot. Price moves up, goes horizontal, and then a chart pattern appears (which can be any bullish pattern, like head‐and‐shoulders bottom, double bottom, or triple bottom). The pattern confirms as valid and price rises some before reversing and heading lower. The pattern busts its upward breakout, handing bulls a loss.
Just recognizing the double bottom (DE) as a tradable pattern isn't enough. If you research the setup by looking at other charts, you'll see how this setup can lead to a failure of a chart pattern.
This (the double bottom, or head‐and‐shoulders, or any bullish pattern at the end of the horizontal top) is a setup you'll want to avoid.
Pothole Setup
Figure 1.6shows a rare setup on the weekly chart, but it's a variation of the pattern shown in the prior figure.
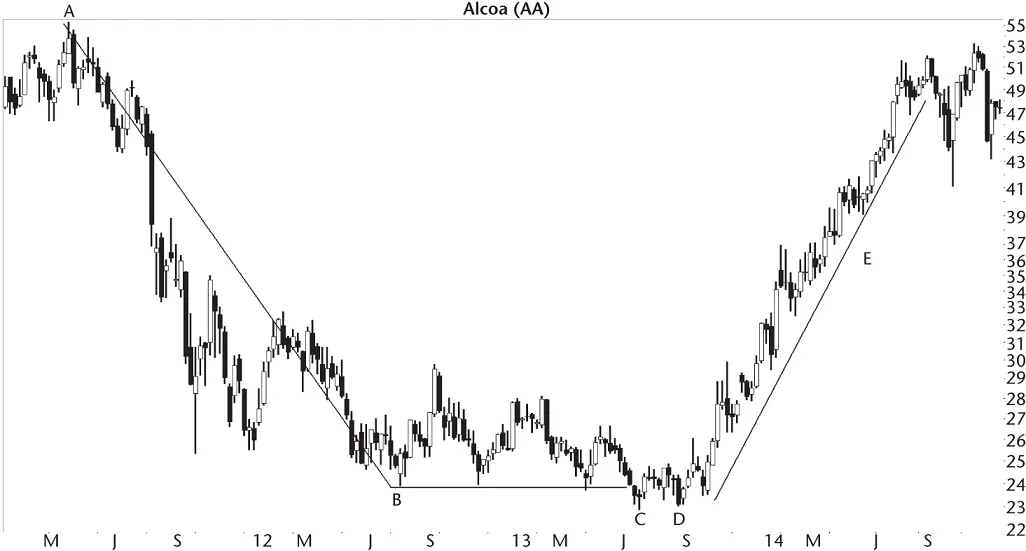
Figure 1.6 A pothole setup happens after a drop and flat base.
The company runs into trouble that lasts for the long term (months). That trouble takes price down from A to bottom at B. At B, the bears want to see the stock continue to drop, but bottom fishers like me see a good value. Buying demand keeps the stock from dropping much farther. A stalemate emerges with neither the bulls nor the bears winning, so the stock just lines sideways (the B to C move).
If the B to C move represents a highway, then CD is a pothole. It's a bear trap, though. Price drops to C and makes another bottom at D, forming a double bottom in this example. The CD move can represent any bullish pattern, like a head‐and‐shoulders bottom or triple bottom. Anyway, price climbs out of the hole and climbs and climbs and climbs (E).
If you're lucky, the stock will rise like it did here, but don't depend on that happening. I also find this example suspicious because it happens in 2013–2014, the same period as Figure 1.3. Still, it provides the template for the pothole setup.
The key to this pattern is the stock forming a bottom (flat base) followed by a pothole. Make sure the flat base appears after a downtrend. You don't want to go long if price trends up into the pattern (like Figure 1.5). See if you can find a reason why the stock wants to climb (during E in Figure 1.6). The reason could be a good quarter with a positive future outlook issued by the company. Maybe the cost of ingredients is going down or the company can raise prices on the goods they sell because the market for widgets is firming up.
If you look back at the figures in this chapter, they all have a flat base, a period of time where the stock goes horizontal. After that horizontal move, a pattern appears. In the first four figures, price drops (after the horizontal move). In the last two figures, a double bottom reversal sends price higher, at least for a time.
If you research these setups (that is, find examples in the stocks you trade), that will give you the confidence to trade a similar setup when it appears in a stock you'd like to own.
Here's another idea to help ease the research burden.
Patternz
I wrote pattern finding software for Windows that I call Patternz and made it available for free to download and use (visit my website: www.ThePatternSite.com). One of the things it does is simulate trades. I load up a bunch of stocks, tell it to find double bottoms (as an example, but they happen often), and let the program find them. Then I look at the context: the double bottom in the surrounding price landscape. I'll guess whether to make the trade or stay in cash, and then let the stock play out. It's like day trading on the 1 millisecond scale (you control playback speed). In seconds, I'll know whether the trade made money or not.
What I'm doing is training my brain not only to view the chart pattern, but to get a feel for the conditions where the pattern will thrive or fail. It's an easy way to train your brain to recognize winning and losing setups.
Suppose you find a stock showing a chart pattern you wish to buy. Spend an hour searching for similar setups using the Patternz simulator and you'll be able to tell whether your trade will likely work or not.
It's easy to find chart patterns. The Patternz software will find them for me. But having the experience to know whether they will work is what separates a seasoned professional from amateurs.
Amateurs are the ones paying for the dreams of the professionals. Stop giving away your money. Take the time to do the research to discover when a chart pattern will work and when it won't. Then put that knowledge to use to fill your wallet or purse.
That's how you trade chart patterns and make money doing it.
Another Way
I mentioned this setup in the introduction to this chapter. Look for a bullish pattern and buy it when it confirms. Sell when a bearish pattern appears. For example, Figure 1.7shows a double bottom at AB. The two valleys bottom near the same price. The squiggles turn into an actual double bottom when price closes above the horizontal line. That happens at C (the breakout). The next day, D, you buy the stock at the opening price and receive a fill of 7.40.
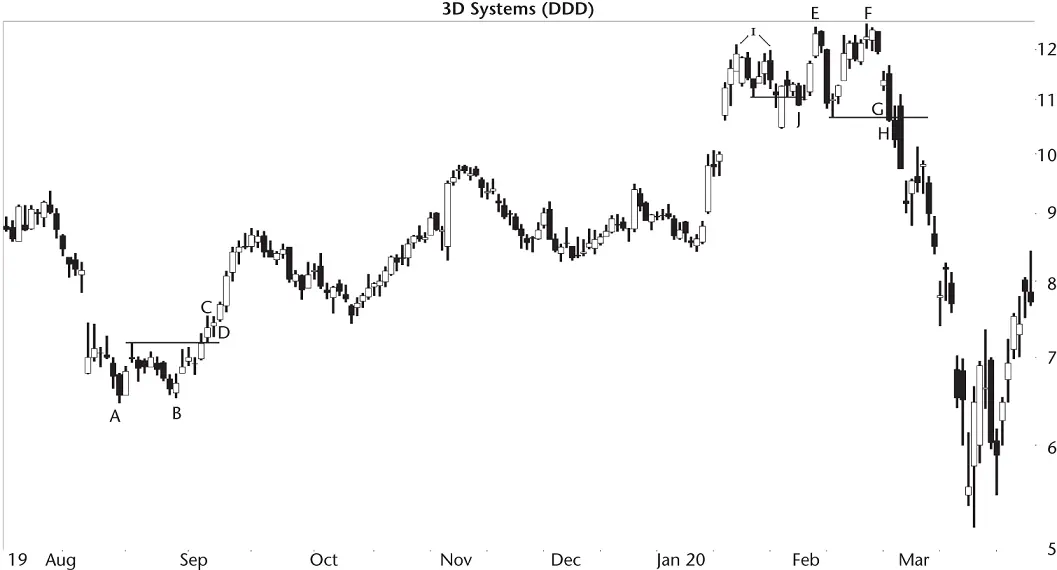
Figure 1.7 Here is a swing trade using a double bottom and a double top.
From then on, you look for a bearish pattern, one that says the stock is going down. A double top appears at EF. The two peaks top out near the same price. It confirms as a valid double top when price closes below the horizontal line, G. The next day, you sell your shares at the open and receive a fill at 10.60. The difference is $3.20 or 43% above the buy price.
In fact, if you had spotted an earlier double top (I), you could have sold a day after the downward breakout (J) and received a slightly better fill, at 11.00, for a net gain on the trade of 49%.
If you sold the day after J, you might be kicking yourself for selling too soon. Why? Because price continued to rise to E and higher to F. If you were astute, you may have recognized a 2B pattern at F and sold sooner, making even more money. Don't look for the 2B pattern in this book because I don't review it. Visit my website for details if you're interested in the 2B.
Of course, I cherry picked this trade, and often things aren't as easy as this example suggests. But the idea is simple. Buy bullish patterns and sell bearish ones. Yes, you'll have to find stocks that you believe show promise in an industry doing well and during a rising market (you will want the stock, industry, and market trending in the same direction for the best result).
You may want to score the chart pattern, too. I described the scoring mechanism in my second book, Trading Classic Chart Patterns . A review of the technique over a decade later shows it still works well. It will help you select patterns that perform better and avoid the duds.
Читать дальшеИнтервал:
Закладка:
Похожие книги на «Encyclopedia of Chart Patterns»
Представляем Вашему вниманию похожие книги на «Encyclopedia of Chart Patterns» списком для выбора. Мы отобрали схожую по названию и смыслу литературу в надежде предоставить читателям больше вариантов отыскать новые, интересные, ещё непрочитанные произведения.


Обсуждение, отзывы о книге «Encyclopedia of Chart Patterns» и просто собственные мнения читателей. Оставьте ваши комментарии, напишите, что Вы думаете о произведении, его смысле или главных героях. Укажите что конкретно понравилось, а что нет, и почему Вы так считаете.