Thomas N. Bulkowski - Encyclopedia of Chart Patterns
Здесь есть возможность читать онлайн «Thomas N. Bulkowski - Encyclopedia of Chart Patterns» — ознакомительный отрывок электронной книги совершенно бесплатно, а после прочтения отрывка купить полную версию. В некоторых случаях можно слушать аудио, скачать через торрент в формате fb2 и присутствует краткое содержание. Жанр: unrecognised, на английском языке. Описание произведения, (предисловие) а так же отзывы посетителей доступны на портале библиотеки ЛибКат.

- Название:Encyclopedia of Chart Patterns
- Автор:
- Жанр:
- Год:неизвестен
- ISBN:нет данных
- Рейтинг книги:3 / 5. Голосов: 1
-
Избранное:Добавить в избранное
- Отзывы:
-
Ваша оценка:
Encyclopedia of Chart Patterns: краткое содержание, описание и аннотация
Предлагаем к чтению аннотацию, описание, краткое содержание или предисловие (зависит от того, что написал сам автор книги «Encyclopedia of Chart Patterns»). Если вы не нашли необходимую информацию о книге — напишите в комментариях, мы постараемся отыскать её.
, Third Edition expands upon Bulkowski's immensely popular Second Edition with fully revised and updated material on chart patterns. Whether you’re new to the stock market or an experienced professional trader, use this book as a reference guide to give you an edge.
Within the pages of this book, you’ll learn how to identify chart patterns, supported by easy-to-understand performance statistics describing how well a pattern works, what the failure rate is, and what special quirks suggest better future performance. You’ll discover how often a stop loss order will trigger at various locations within a chart pattern, how the chart pattern’s performance has evolved over the past three decades, and how to profit from failure by trading busted patterns.
This broadened and revised
offers investors the most comprehensive, up-to-date guide to this popular method of market analysis. Written by a leading expert on chart patterns, Tom Bulkowski, this edition includes revised statistics on 75 chart patterns including 23 new ones, with pictures and performance statistics, packaged within easy-to-read text.
Gain essential knowledge of chart patterns and how they are used to predict price movements in bull and bear markets New tables include how often stops are hit, busted pattern performance, performance over the decades, and special pattern features Joining Tour, Identification Guidelines, Focus on Failures, Statistics, Trading Tactics and Sample Trade is Experience. It puts you in the passenger’s seat so you can share lessons learned from Bulkowski's trades This edition reports on statistics from nearly four times the number of samples used in the Second Edition and ten times the number in the , Third Edition further solidifies the reputation of this book as the leading reference on chart patterns, setting it far above the competition.
Encyclopedia of Chart Patterns — читать онлайн ознакомительный отрывок
Ниже представлен текст книги, разбитый по страницам. Система сохранения места последней прочитанной страницы, позволяет с удобством читать онлайн бесплатно книгу «Encyclopedia of Chart Patterns», без необходимости каждый раз заново искать на чём Вы остановились. Поставьте закладку, и сможете в любой момент перейти на страницу, на которой закончили чтение.
Интервал:
Закладка:
Two years later, Tom pulls up the stock chart. The dog has been flat for so long it looks as if its heartbeat has stopped. He calls Jim and chats about the outlook for JCB Superstores. Jim gushes enthusiastically about a new retailing concept called the Internet. He is excited about the opportunity to sell office supplies online without the need for bricks and mortar. There is some risk because the online community is in its infancy, but Jim predicts demand will expand quickly. Tom is impressed, so he starts doing his homework and is soon buying the stock again.
Investment Footprints
If you picture in your mind the price action of JCB Superstores, you may recognize three chart patterns: a double bottom, a double top, and a dead‐cat bounce. To knowledgeable investors, chart patterns are not squiggles on a price chart; they are the footprints left by the smart money. The footprints are all they need to follow as they line their pockets with greater and greater riches.
To others, such as Tom, it takes hard work and pavement pounding before they dare take a position in a stock. They are the ones making the footprints. They are the smart money that is setting the rules of the game—a game anyone can play. It is called investing.
Whether you choose to use technical analysis or fundamental analysis in your trading decisions, it pays to know what the market is thinking. It pays to look for the footprints. Those footprints may well steer you away from a cliff and get you out of a stock just in time. The feet that make those footprints are the same ones that will kick you in the pants, waking you up to a promising investment opportunity.
This book gives you the tools to spot the footprints, where they predict the stock is heading, how far it will travel, and how reliable the trail really is. The tools will not make you rich; tools rarely do. But they are instruments to greater wealth. Use them wisely.
The Database
Let me tell you about the stocks I used to compile the statistics in this book.
1,396 stocks were used; most start in July 1991 and extend into 2020.
Not all stocks covered the entire period.
Some stocks no longer trade. It's important to include what happens when a company goes bankrupt or merged out of existence.
All stocks use daily price data, not intraday, but some chapters use weekly or monthly data.
Most chart patterns were added in real time as new data arrives each day. This avoids look‐ahead bias (where I only catalog patterns I can see have done well).
The real‐time addition of data was done for more than 20 years.
All stocks have been split adjusted unless I no longer actively follow them.
When a new stock is added to the database, it may have been dividend adjusted by the data provider. However, I don't adjust stocks I use in my database for dividends.
A stock becomes part of the database provided it trades above $5 a share (usually), isn't thinly traded (I like to see daily volume over 100,000 shares), and the stock has a heartbeat (meaning it has a reasonable high–low yearly trading range).
Market capitalization varies with all three represented (small, medium, and large).
Most stocks chosen are from American companies whose stocks trade on the NYSE or NASDAQ exchanges.
The Sample Trade
Most of the sample trades included in the chapters of this book are fictitious. Each sample trade uses techniques I wanted to illustrate, incorporating fictitious people in sometimes unusual circumstances. Call it poetic license, but I hope they give you some ideas on how to increase your profits or minimize your losses. Maybe you'll find them entertaining, too.
Testing Chart Patterns
How do you test chart patterns? It's not an easy question to answer. If you use commonly available software that tests trading strategies, you'll enter rules to model the shape of a double bottom, for example. When price closes above the top of the pattern, it signals an entry, so the software simulates a buy.
What about the exit signal? When do you sell? Should you use a stop‐loss order or a signal from MACD or even a moving average crossover? No. Why not? Because you're not testing the chart pattern. You're testing how well a stop‐loss order works or you're testing MACD or the moving average crossover system.
So I invented two tools I call the ultimate high and ultimate low to solve the testing problem.
Let's look at a chart so I can explain how these work and you'll understand the statistics in this book. Figure I.1shows two chart patterns, a double bottom and a head‐and‐shoulders top. Let's take the double bottom first.
Trading the Double Bottom
It appears at AB, two valleys that bottom near the same price. A buy signal occurs when price closes above the top of the pattern. The top of the pattern is at C and the entry signal (breakout) happens at D when price closes above the top of the double bottom. Entry is made the next day using the opening price, which is 17.06.
Let's say you're using traditional software and place a stop‐loss order a penny below the low price of B, which is 15.70.
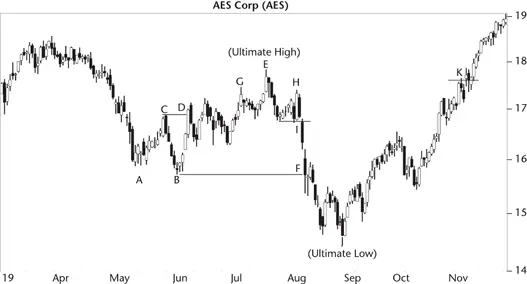
Figure I.1 A double bottom signals a trade entry at D and an exit at the ultimate high. A head‐and‐shoulders top signals an entry at I and an exit at the ultimate low.
The computer watches the stock rise to E and then drop. When it touches the stop‐loss order at 15.70, which happens at F, it closes out the trade. So this trade entered at 17.06, sold at 15.70, and took a loss of $1.36 a share.
Does this mean the double bottom lost $1.36 a share? No. It means the stop‐loss order lost that much. You tested the stop‐loss order, not the double bottom.
What do I mean?
Pretend that when price climbed to E, you raised the stop‐loss order to 17.43 (which is the high price of G). When price dropped to 17.43, the stock sold and it handed you a gain this time of 37 cents a share. Did the double bottom make a profit? No. The stop‐loss order did.
As you move the stop‐loss order around, you get different sell prices. You're not testing the double bottom. You're testing how well the stop‐loss order works at different values. So we haven't answered the basic question, “how do you test chart patterns?”
Given the same entry signal (17.06), let's say you traded this stock perfectly. Where would you sell? When price slides below F, you'll be taking a loss if you have to sell, so trying to shoot for 19 on the upper right of the chart isn't optimum. The trade goes negative for a while before it shows a profit.
Ultimate High
How about selling at E, when price peaks? That would give you the most profit before the stock dropped into loss territory. That peak is what I call the ultimate high. If you traded this stock perfectly, you'd buy at 17.06, using the opening price the day after an upward breakout, and you'd sell at the high price at E.
I'm not testing how well a stop‐loss order works because I'm not using a stop or MACD or a moving average crossover system to find the exit. I'm selling at the highest possible price before things go wrong. I'm selling at the ultimate high. A perfect double bottom trade.
How do I automate this? In my software, I use two rules to find the ultimate high (on a historical price chart, not real time).
1 Find the highest high before price drops 20%, measured from the high to the close.
2 If price closes below the bottom of the chart pattern, then the search for the ultimate high stops, and we use the highest high found after entering the trade.
Читать дальшеИнтервал:
Закладка:
Похожие книги на «Encyclopedia of Chart Patterns»
Представляем Вашему вниманию похожие книги на «Encyclopedia of Chart Patterns» списком для выбора. Мы отобрали схожую по названию и смыслу литературу в надежде предоставить читателям больше вариантов отыскать новые, интересные, ещё непрочитанные произведения.


Обсуждение, отзывы о книге «Encyclopedia of Chart Patterns» и просто собственные мнения читателей. Оставьте ваши комментарии, напишите, что Вы думаете о произведении, его смысле или главных героях. Укажите что конкретно понравилось, а что нет, и почему Вы так считаете.