Eleftheria Papadimitriou - Statistical Methods and Modeling of Seismogenesis
Здесь есть возможность читать онлайн «Eleftheria Papadimitriou - Statistical Methods and Modeling of Seismogenesis» — ознакомительный отрывок электронной книги совершенно бесплатно, а после прочтения отрывка купить полную версию. В некоторых случаях можно слушать аудио, скачать через торрент в формате fb2 и присутствует краткое содержание. Жанр: unrecognised, на английском языке. Описание произведения, (предисловие) а так же отзывы посетителей доступны на портале библиотеки ЛибКат.
- Название:Statistical Methods and Modeling of Seismogenesis
- Автор:
- Жанр:
- Год:неизвестен
- ISBN:нет данных
- Рейтинг книги:5 / 5. Голосов: 1
-
Избранное:Добавить в избранное
- Отзывы:
-
Ваша оценка:
Statistical Methods and Modeling of Seismogenesis: краткое содержание, описание и аннотация
Предлагаем к чтению аннотацию, описание, краткое содержание или предисловие (зависит от того, что написал сам автор книги «Statistical Methods and Modeling of Seismogenesis»). Если вы не нашли необходимую информацию о книге — напишите в комментариях, мы постараемся отыскать её.
Statistical Methods and Modeling of Seismogenesis — читать онлайн ознакомительный отрывок
Ниже представлен текст книги, разбитый по страницам. Система сохранения места последней прочитанной страницы, позволяет с удобством читать онлайн бесплатно книгу «Statistical Methods and Modeling of Seismogenesis», без необходимости каждый раз заново искать на чём Вы остановились. Поставьте закладку, и сможете в любой момент перейти на страницу, на которой закончили чтение.
Интервал:
Закладка:
Figure 2.18(b) shows the standard deviation (again in a normalized scale) of stress on the cells of each segment. Figure 2.18(c) shows the ratio between the values of the average stress and its standard deviation. This parameter increases always and only before a strong earthquake. Assuming that the trend shown in Figure 2.17before large earthquakes (i.e. stress becomes higher and more uniform on a relevant patch of the fault system) is a phenomenon that happens in reality, it could be regarded as a promising tool for forecasting strong events. Unfortunately, it is not feasible to map the stress on the fault surface in the real environment with the necessary resolution. However, some seismicity patterns observable by means of modern high-quality seismic networks, such as spatio-temporal changes of b-value, could be associated with stress variation in the crust and applied in an operational forecasting system (Montuori et al . 2016; Gulia et al . 2016; Gulia and Wiemer 2019).
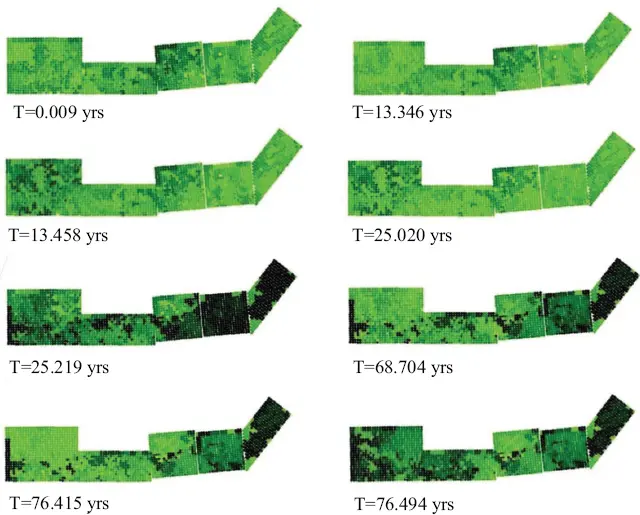
Figure 2.17. Stress time history on the Nankai seismogenic structure for the first 76 years. For a color version of this figure, see www.iste.co.uk/limnios/statistical.zip
2.5. Appendix 1: Relations among source parameters adopted in the simulation model
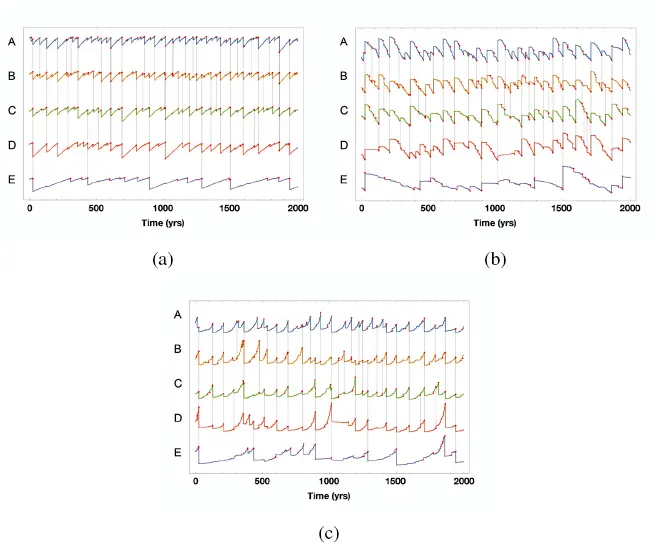
Figure 2.18. (a) The time history (in a normalized scale) of the average stress computed on all the cells of each segment from A to E in a time span of 2,000 years. Vertical bars indicate the occurrence time of earthquakes whose ruptures significantly modified the stress of more than one segment. The increase in stress is mostly due to tectonic loading, but is also due to stress transfer from the cells of a segment to the others. The average stress drops at the time of each earthquake according to the size of the rupture on the specific segment participating in the earthquake. (b) The same as in the top panel for the standard deviation of stress on the cells of each segment. The standard deviation decreases (i.e. the stress becomes more uniform) when the occurrence time of earthquakes approaches. (c) Ratio between the values of the average stress and its standard deviation. This parameter increases always and only before a strong earthquake, as a possible precursor of large size events. For a color version of this figure, see www.iste.co.uk/limnios/statistical.zip
This appendix provides the theoretical framework of the model adopted in the simulation algorithms described in section 2.3. Because the magnitudes of the earthquakes of the synthetic catalog generated by the algorithm are obtained from their seismic moments, and the number of these earthquakes per unit time must fit the constraint of the slip rate assigned to any fault segment of the model, it is necessary to adopt relationships between the magnitude and both the rupture area and the average slip of each event.
The scalar seismic moment of an earthquake is defined as:
[2.5] 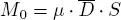
where μ is the shear modulus of the elastic medium,  is the average slip on the fault and S is the rupture area, that for a rectangular shape is the product of the length L by the width W. From the theory of elasticity, the energy released by a fracture through elastic waves is given by:
[2.6] 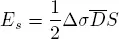
where Δ σ is the static stress drop of the earthquake. From [2.5]and [2.6], we obtain:
[2.7] 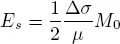
Two widely used formulas link the seismic moment and the seismic energy of an earthquake with magnitude:
[2.8] 
[2.9] 
Substituting [2.8]and [2.9]into [2.7], we obtain:
[2.10] 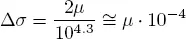
and adopting a value μ = 3.3 • 10 10Pa for rocks in the Earth’s crust:
[2.11] 
For a rectangular rupture, in analogy with the theoretical formulas introduced for a circular fault by Keilis Borok (1959), the following relations were proposed by Console and Catalli (2006):
[2.12] 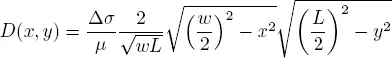
[2.13] 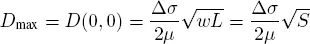
[2.14] 
where x and y are the coordinates on the fault plane, counted from the center of the rectangular source, D(x, y) is the displacement on the point x and y coordinates and D maxis the displacement on the fault center. From the definition of seismic moment [2.5]:
[2.15] 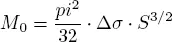
Combining [2.5], [2.9], [2.14]and [2.15], we have:
[2.16] 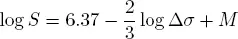
and
[2.17] 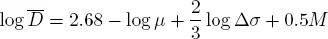
Dividing equation [2.14]by the average interevent time, we obtain a relation between the stress rate and the slip rate:
[2.18] 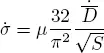
2.6. Appendix 2: Outline of the simulation program
Purpose: creating a synthetic earthquake catalog in a seismogenic region described by a rectangular fault, divided into segments of different slip rate. The fault geometry is described by the total along-strike length of the fault system (L), the length and the tectonic slip rate of each segment, a uniform down-dip width (W) and the cell length (a) and width (b). Assuming a stress drop Δ σ = 3.3 10 6Pa, the slip, seismic moment and magnitude of an earthquake on a single cell is computed (see the appendix in section 2.5). The following parameters are used by the algorithm:
Читать дальшеИнтервал:
Закладка:
Похожие книги на «Statistical Methods and Modeling of Seismogenesis»
Представляем Вашему вниманию похожие книги на «Statistical Methods and Modeling of Seismogenesis» списком для выбора. Мы отобрали схожую по названию и смыслу литературу в надежде предоставить читателям больше вариантов отыскать новые, интересные, ещё непрочитанные произведения.


Обсуждение, отзывы о книге «Statistical Methods and Modeling of Seismogenesis» и просто собственные мнения читателей. Оставьте ваши комментарии, напишите, что Вы думаете о произведении, его смысле или главных героях. Укажите что конкретно понравилось, а что нет, и почему Вы так считаете.