Eleftheria Papadimitriou - Statistical Methods and Modeling of Seismogenesis
Здесь есть возможность читать онлайн «Eleftheria Papadimitriou - Statistical Methods and Modeling of Seismogenesis» — ознакомительный отрывок электронной книги совершенно бесплатно, а после прочтения отрывка купить полную версию. В некоторых случаях можно слушать аудио, скачать через торрент в формате fb2 и присутствует краткое содержание. Жанр: unrecognised, на английском языке. Описание произведения, (предисловие) а так же отзывы посетителей доступны на портале библиотеки ЛибКат.
- Название:Statistical Methods and Modeling of Seismogenesis
- Автор:
- Жанр:
- Год:неизвестен
- ISBN:нет данных
- Рейтинг книги:5 / 5. Голосов: 1
-
Избранное:Добавить в избранное
- Отзывы:
-
Ваша оценка:
Statistical Methods and Modeling of Seismogenesis: краткое содержание, описание и аннотация
Предлагаем к чтению аннотацию, описание, краткое содержание или предисловие (зависит от того, что написал сам автор книги «Statistical Methods and Modeling of Seismogenesis»). Если вы не нашли необходимую информацию о книге — напишите в комментариях, мы постараемся отыскать её.
Statistical Methods and Modeling of Seismogenesis — читать онлайн ознакомительный отрывок
Ниже представлен текст книги, разбитый по страницам. Система сохранения места последней прочитанной страницы, позволяет с удобством читать онлайн бесплатно книгу «Statistical Methods and Modeling of Seismogenesis», без необходимости каждый раз заново искать на чём Вы остановились. Поставьте закладку, и сможете в любой момент перейти на страницу, на которой закончили чтение.
Интервал:
Закладка:
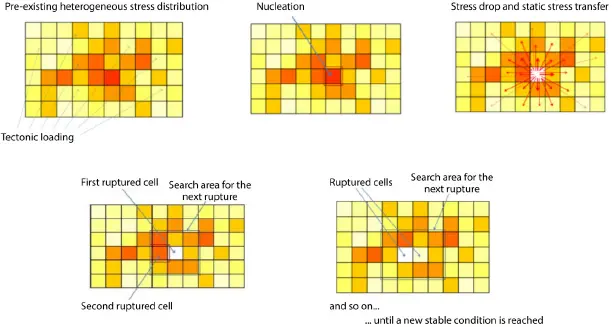
Figure 2.4. Scheme of rupture nucleation and propagation adopted in this earthquake simulator (based on Console et al . 2017). For a color version of this figure, see www.iste.co.uk/limnios/statistical.zip
The simulation algorithm, in its simplicity, provides preference for new ruptures to nucleate at the points of the fault where the stress budget is higher, i.e. where the time elapsed since the latest event is longer. Once it is nucleated, the rupture expands in the directions where the stress budget is still higher, thus simulating a preference for filling pre-existing gaps and epicenter migration. Moreover, because of the stress transfer included in the model, earthquakes are more likely to occur close to the borders of the rupture of a preceding large earthquake, simulating a feature similar to aftershock production.
2.3.2. Frequency-magnitude distribution of the simulated catalog (2015)
In the application of the simulator, the rectangular source area representing the CGFS was discretized in 6,288 cells of 0.5 × 0.5 km. We chose for the synthetic catalogs a minimum magnitude of 4.0, which is produced approximately by the rupture of six cells. According to the “Ellsworth B” relation between magnitude and fault area (WGCEP 2003), the magnitude of earthquakes rupturing the entire CGFS (the area of which is 1,572 km 2) would be 7.4. The duration of all the synthetic catalogs was 100,000 years. In order to explore the effect of the two free parameters, S-R and A-R separately, we carried out a series of eight simulations, each time using different combinations of these parameters. This effect is illustrated in Figure 2.5by the magnitude-frequency density distribution of the earthquakes contained in the respective synthetic catalogs. Figures 2.5(a)and 2.5(b)show that the first free parameter, S-R, does have influence on the total number of earthquakes contained in the catalogs. The difference clearly comes from the substantial contribution given to the moment released by the high magnitude range, maintaining the same constraint for the moment rate released by the entire fault system.
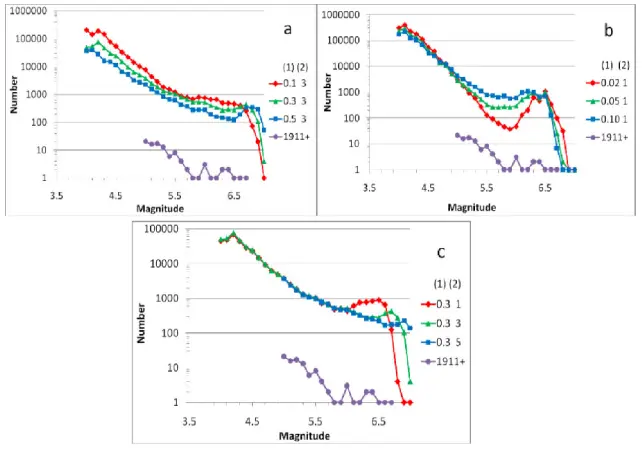
Figure 2.5. Frequency-magnitude distribution of the earthquakes in the synthetic catalogs obtained from the simulation algorithm with different combinations of two free parameters described in the text. In panels a, b and c, labels (1) and (2) refer to the values of parameters S-R and A-R, respectively. The total seismic moment released by the events in all the synthetic catalogs is the same. The bottom data refer to the earthquakes observed in the area starting in 1911 (based on Console et al . 2015). For a color version of this figure, see www.iste.co.uk/limnios/statistical.zip
Figure 2.5(c), where the three plots refer to three different values of the second free parameter A-R, does not show visible differences in the distribution below magnitude 6.0, but a clear difference of the shape above this threshold. This is explained by the fact that parameter A-R has discourages the size of a rupture to expand beyond a length that exceeds A-R times the width of the fault segment. All the plots shown in Figure 2.5show a clear deviation of the magnitude distribution obtained by the simulation algorithm from a plain linear Gutenberg–Richter distribution. In some cases, the magnitude distributions show a sharp “bump” around a value of magnitude that could be defined as “characteristic” behavior. All three panels of Figure 2.5also show the magnitude density distribution of the real earthquakes observed in the Corinth fault system and reported in the seismic catalog since 1911. On the basis of a visual comparison, it seems possible to recognize the set of free parameters (0.10, 1.0) as the one that exhibits the best match between the real and simulated catalogs ( Figure 2.5(b)), taking into account the large difference in the different scale of the total number of events. This combination of parameters produces a nearly flat magnitude distribution (i.e. a b-value equal to 0) in the magnitude range 5.5 < M < 6.5 that reminds us of the unsegmented option of the WGCEP (2008). In the following, we shall show results of a simulation lasting 100,000 years, obtained by running our algorithm with the selected free parameters S-R and A-R, respectively, equal to 0.1 and 1.0.
2.3.3. Temporal features of the synthetic catalog (2015)
In order to test the potential use of the simulation algorithm for drawing conclusions about the predictability of large earthquakes, one should make a comparison between the synthetic and the real catalog. The analysis was based on some arbitrary criteria to attribute a specific earthquake to one or more segments. The rules adopted for this purpose are: the earthquake must have a minimum magnitude of 6.0; the earthquake is first assigned to the segment that contains the largest number of fractured cells; the same earthquake can also be assigned to other segments if the number of cells ruptured by the event exceeds the number of 600 or at least 80% of the total number of cells for the specific segment. Examples of time-space plots of the synthetic catalogs obtained after applying the above-mentioned criteria to the first 2,500 years are shown by blue bars in Figure 2.6. For the sake of comparison, this figure also shows the 17 earthquakes that are reported in the real catalog since 1700 CE (red squares).
A visual inspection of Figure 2.6does not reveal any systematic behavior that can be recognized as substantial discrepancy between the synthetic and the real catalogs. Note that Figure 2.6displays all the ruptures that constitute a single earthquake as individual events. This justifies the apparent larger number of synthetic events with respect to those reported in the real catalog (which assigns each earthquake to a single segment, independently of its size). We observe a non-periodical time distribution, with interevent times ranging from a few years to hundreds of years on the same segment. We can also see earthquakes that rupture different segments as a unique event or more events that occur with very short time separation. This feature is consistent with historical observations.

Figure 2.6. Space-time features of synthetic catalogs concerning earthquakes with M > 6.0 for the first 2,500 years (blue bars). Red squares show the occurrence time and location of the observed earthquakes in the last 300 years (based on Console et al. 2015). For a color version of this figure, see www.iste.co.uk/limnios/statistical.zip
In order to assess whether the earthquake occurrence time on the same segments in the synthetic catalogs behaves as a Poisson process or not, we carried out a statistical analysis of the interevent times for the entire 100,000 years simulation. In this respect, Figure 2.7shows the interevent time distribution of the simulation. Table 2.1displays the mean interevent time, the standard deviation and the coefficient of variation for each segment. The relatively short average interevent times of the simulations can be justified by the circumstance that often two or more segments rupture simultaneously in a single earthquake. Along with the above-mentioned temporal parameters, Table 2.1also reports the results of the difference between the log-likelihood computed by the BPT renewal model and the Poisson time-independent model (dlogL). For the likelihood estimation, we have adopted the values obtained for Tr and Cν reported in Table 2.1for each fault segment.
Читать дальшеИнтервал:
Закладка:
Похожие книги на «Statistical Methods and Modeling of Seismogenesis»
Представляем Вашему вниманию похожие книги на «Statistical Methods and Modeling of Seismogenesis» списком для выбора. Мы отобрали схожую по названию и смыслу литературу в надежде предоставить читателям больше вариантов отыскать новые, интересные, ещё непрочитанные произведения.


Обсуждение, отзывы о книге «Statistical Methods and Modeling of Seismogenesis» и просто собственные мнения читателей. Оставьте ваши комментарии, напишите, что Вы думаете о произведении, его смысле или главных героях. Укажите что конкретно понравилось, а что нет, и почему Вы так считаете.