Eleftheria Papadimitriou - Statistical Methods and Modeling of Seismogenesis
Здесь есть возможность читать онлайн «Eleftheria Papadimitriou - Statistical Methods and Modeling of Seismogenesis» — ознакомительный отрывок электронной книги совершенно бесплатно, а после прочтения отрывка купить полную версию. В некоторых случаях можно слушать аудио, скачать через торрент в формате fb2 и присутствует краткое содержание. Жанр: unrecognised, на английском языке. Описание произведения, (предисловие) а так же отзывы посетителей доступны на портале библиотеки ЛибКат.
- Название:Statistical Methods and Modeling of Seismogenesis
- Автор:
- Жанр:
- Год:неизвестен
- ISBN:нет данных
- Рейтинг книги:5 / 5. Голосов: 1
-
Избранное:Добавить в избранное
- Отзывы:
-
Ваша оценка:
Statistical Methods and Modeling of Seismogenesis: краткое содержание, описание и аннотация
Предлагаем к чтению аннотацию, описание, краткое содержание или предисловие (зависит от того, что написал сам автор книги «Statistical Methods and Modeling of Seismogenesis»). Если вы не нашли необходимую информацию о книге — напишите в комментариях, мы постараемся отыскать её.
Statistical Methods and Modeling of Seismogenesis — читать онлайн ознакомительный отрывок
Ниже представлен текст книги, разбитый по страницам. Система сохранения места последней прочитанной страницы, позволяет с удобством читать онлайн бесплатно книгу «Statistical Methods and Modeling of Seismogenesis», без необходимости каждый раз заново искать на чём Вы остановились. Поставьте закладку, и сможете в любой момент перейти на страницу, на которой закончили чтение.
Интервал:
Закладка:
Suppose that the current latest event occurred at the origin time t 0. The expected number N of new events in the time interval t 0+ Δ t < t < t 0+ 1.5Δ t can be obtained for all the cells of the fault system by integration from Δ t to 1.5Δ t by the occurrence rate of equation [2.3], starting with a very small Δ t time interval (e.g. 1 second). Here, the integration is approximated by multiplying the occurrence rate at time 1.25 Δ t by 0.5 Δ t . After a strong event, the cells with large positive ΔCFF will have high rates, and the cells with large negative ΔCFF will have low rates. The probability of at least one event occurring in the Δ t time interval is given by 1 –exp(– N ) on the basis of a Poisson distribution. If a cell exists where the probability exceeds a random number uniformly distributed between 0 and 1, that cell is assigned as the nucleation point for a new event and its occurrence time is assigned a value randomly distributed between t 0+ Δ t and t 0+ 1.5Δ t , otherwise new probabilities are computed, increasing Δ t by a factor of 1.5 and compared with random numbers. If more than one cell fulfills the criterion of exceedance of the random number, the cell with the largest probability is assumed as the nucleation cell. The process is repeated until the condition of exceedance for the probability in any of the cells is met and the rupture of a new event starts. According to equation [2.3], after the rate change caused by an event, if no other perturbation happens, the rate r gradually returns to the background rate r 0. By the application of this algorithm in the new version of the simulator, the nucleation point and occurrence time for events is determined randomly by a stochastic procedure, rather than by a deterministic rule. As it will be shown later, the synthetic catalogs obtained using this new algorithm proved to contain realistic features of event clustering after strong events, not achieved by the previous versions.
2.4. Application of the last version of the simulator to the Nankai mega-thrust fault system
The physical model on which the latest version of our simulation algorithm is based also includes, besides tectonic stress loading and static stress transfer as in the previous versions, the rate-and-state constitutive law. The simulator code can be run on a relatively modest computer and is capable of simulating thousands of years of seismic activity, producing catalogs of tens of thousands of events in a wide range of magnitudes. In this study, we apply the simulator code to a physical model of the Nankai mega-thrust, a well-known seismic structure 650 km long, aligned with the Pacific Ocean coast of Southern Japan, which generated several earthquakes of magnitude larger than 8.0 in the last 13 centuries ( Table 2.2). This structure is typically modeled as sub-divided in five main segments characterized by different slip rates, which can rupture separately from or simultaneously with each other ( Figure 2.14).
We ran the simulator for 3,000 years and included a warm up period of 1,000 years. The 2,000 years output synthetic catalog contains 9,635 events of magnitude ranging from 5.6 (earthquakes rupturing only two cells) to 8.48 (an earthquake rupturing 1,838 cells of segments A-D). Table 2.3displays some of the main features of the synthetic catalog and Figure 2.15shows its magnitude distribution.
Following the method described in section 2.3.3, we carried out a statistical analysis of the interevent times for the 2,000 years worth of simulation of the seismicity in the Nankai fault system. According to “Ellsworth B” equation (WGCEP 2003), already mentioned in section 2.3.2, the magnitude of earthquakes rupturing the entire area of one of the segments named from A to E in Figure 2.12would range from 8.2 and 8.4. In this study, we considered the statistics of events with a magnitude equal to or larger than 8.0, capable of rupturing a relevant part of one or more of these segments. Figure 2.16shows the interevent time distribution of the simulation.
Table 2.2. List of observed or argued mega-earthquakes that ruptured two or more segments of the Nankai mega-thrust (from Parsons et al . 2013)
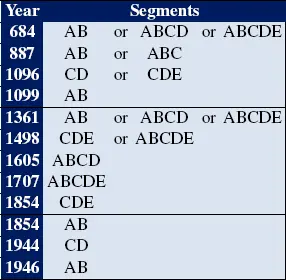
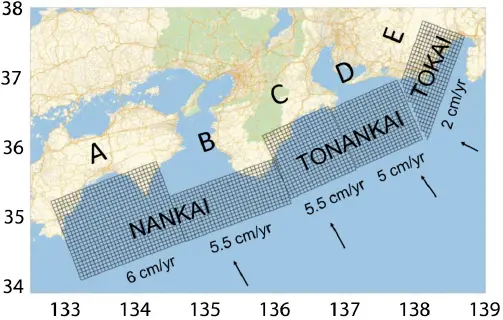
Figure 2.14. Simplified model of the Nankai mega-thrust. The seismogenic structure is modeled by quadrilateral faults, each of which is composed of square cells of 5 × 5 km. For a color version of this figure, see www.iste.co.uk/limnios/statistical.zip
Table 2.4displays the mean interevent time, the standard deviation and the coefficient of variation for each segment. The relatively short average interevent times of the simulations can be justified by the circumstance that often two or more segments rupture simultaneously in a single earthquake. Along with the above-mentioned temporal parameters, Table 2.4also reports the results of the difference between the log-likelihood computed by the BPT renewal model and the Poisson time-independent model (dlogL). For the likelihood estimation, we have adopted the values obtained for Tr and Cv reported in Table 2.4for each fault segment.
Table 2.3. Features of the 2,000 years synthetic catalog
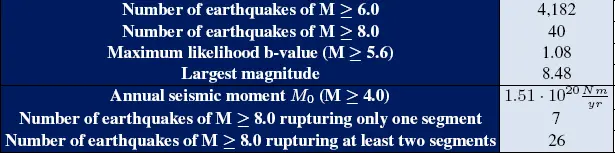
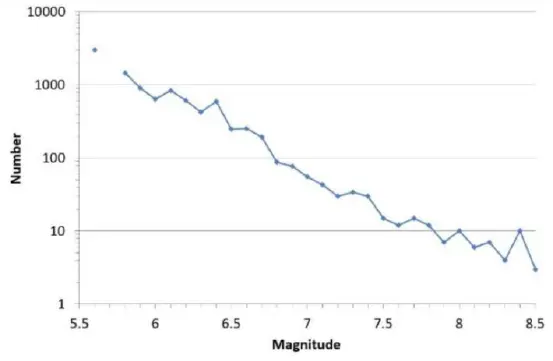
Figure 2.15. Frequency magnitude distribution of the 2,000 years synthetic catalog
Both Figure 2.16and Table 2.4show, as expected, that the most active segments are those characterized by higher slip rate (such as A, B and C). The simulation also shows that for the less active segments (E), interevent times longer than 400 years are possible. The coefficient of variation Cv is typically close to 0.3, which can be associated with remarkably time-predictable behavior of the seismicity. The log-likelihood difference denotes a better performance of the renewal model against the time-independent hypothesis. As the simulator algorithm allows the computing of the stress on all the cells constituting the seismic structure adopted in the model, we may build up the stress history on each cell and display it in a sort of animation ( Figure 2.17).
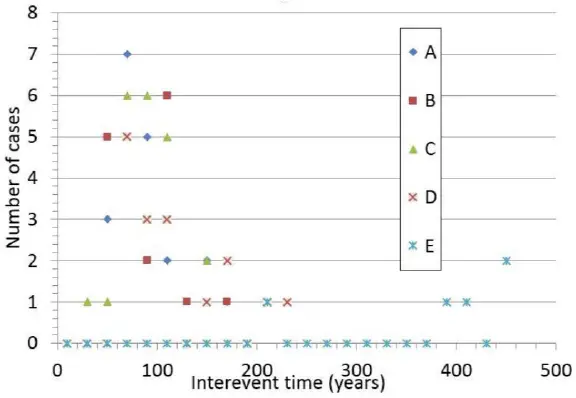
Figure 2.16. Interevent time distribution from a simulation of 2,000 years of seismic activity across the Nankai mega-thrust fault system. For a color version of this figure, see www.iste.co.uk/limnios/statistical.zip
Table 2.4. Statistical parameters of the 2,000 years synthetic catalog of the Nankai mega-thrust fault system
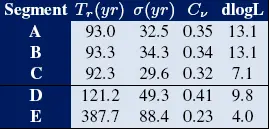
Figure 2.18(a) shows (in a normalized scale) the time variation of the average stress computed on all the cells of each segment from A to E in a time span of 2,000 years. Vertical bars indicate the occurrence time of earthquakes whose ruptures significantly modified the stress of more than one segment. The increase of stress is mostly due to tectonic loading, but is also due to stress transfer from the cells of a segment to the others. The average stress drops at the time of each earthquake according to the size of the rupture on the specific segment participating in the earthquake.
Читать дальшеИнтервал:
Закладка:
Похожие книги на «Statistical Methods and Modeling of Seismogenesis»
Представляем Вашему вниманию похожие книги на «Statistical Methods and Modeling of Seismogenesis» списком для выбора. Мы отобрали схожую по названию и смыслу литературу в надежде предоставить читателям больше вариантов отыскать новые, интересные, ещё непрочитанные произведения.


Обсуждение, отзывы о книге «Statistical Methods and Modeling of Seismogenesis» и просто собственные мнения читателей. Оставьте ваши комментарии, напишите, что Вы думаете о произведении, его смысле или главных героях. Укажите что конкретно понравилось, а что нет, и почему Вы так считаете.