Eleftheria Papadimitriou - Statistical Methods and Modeling of Seismogenesis
Здесь есть возможность читать онлайн «Eleftheria Papadimitriou - Statistical Methods and Modeling of Seismogenesis» — ознакомительный отрывок электронной книги совершенно бесплатно, а после прочтения отрывка купить полную версию. В некоторых случаях можно слушать аудио, скачать через торрент в формате fb2 и присутствует краткое содержание. Жанр: unrecognised, на английском языке. Описание произведения, (предисловие) а так же отзывы посетителей доступны на портале библиотеки ЛибКат.
- Название:Statistical Methods and Modeling of Seismogenesis
- Автор:
- Жанр:
- Год:неизвестен
- ISBN:нет данных
- Рейтинг книги:5 / 5. Голосов: 1
-
Избранное:Добавить в избранное
- Отзывы:
-
Ваша оценка:
Statistical Methods and Modeling of Seismogenesis: краткое содержание, описание и аннотация
Предлагаем к чтению аннотацию, описание, краткое содержание или предисловие (зависит от того, что написал сам автор книги «Statistical Methods and Modeling of Seismogenesis»). Если вы не нашли необходимую информацию о книге — напишите в комментариях, мы постараемся отыскать её.
Statistical Methods and Modeling of Seismogenesis — читать онлайн ознакомительный отрывок
Ниже представлен текст книги, разбитый по страницам. Система сохранения места последней прочитанной страницы, позволяет с удобством читать онлайн бесплатно книгу «Statistical Methods and Modeling of Seismogenesis», без необходимости каждый раз заново искать на чём Вы остановились. Поставьте закладку, и сможете в любой момент перейти на страницу, на которой закончили чтение.
Интервал:
Закладка:
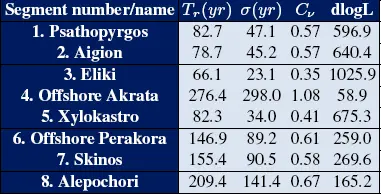
Both Figure 2.7and Table 2.1show, as expected, that the most active segments are those characterized by larger size and higher slip rate (such as Psathopyrgos, Aigion, Eliki and Xylokastro). The simulation also shows that, especially for the less active segments (offshore Perachora, Skinos and Alepochori), interevent times of several hundreds of years are possible. The coefficient of variation Cν is typically close to 0.6, which would be associated with moderately time-predictable behavior of the seismicity. The log-likelihood difference denotes an outstanding better performance of the renewal model against the time-independent hypothesis. The exception to this pseudo-periodical behavior is presented by segment #4 (offshore Akrata), which exhibits a coefficient of variation slightly larger than 1 and a modest log-likelihood difference.
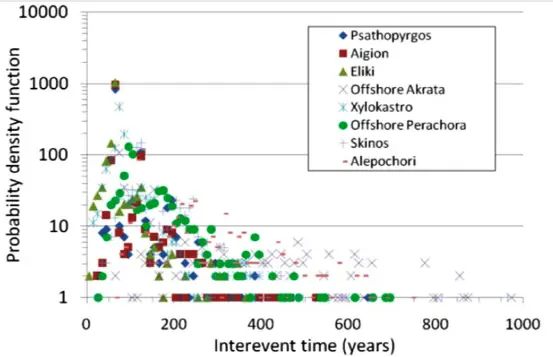
Figure 2.7. Interevent time distribution from a simulation of 100,000 years of seismic activity across the CGFS (based on Console et al. 2015). For a color version of this figure, see www.iste.co.uk/limnios/statistical.zip
Table 2.1. Statistical parameters of the synthetic catalog (based on Console et al. 2015) .
2.3.4. Improvements in the physics-based earthquake simulator (2017–2018)
The next versions of the simulation algorithm developed by our group included the following improvements that make the physics of the model more realistic (Console et al . 2017, 2018a,b): The occurrence time for the nucleation of a new rupture is computed for the cell of the fault model that has the shortest time for reaching a stress exceeding the respective strength threshold; this speeds up the computations made by the computer code between two consecutive events. The fault geometry allows faults with any orientation and size in a three-dimensional space and their source mechanisms may be different from fault to fault: an expanding rupture may jump from one fault to another, according to a criterion of maximum distance from a cell on the border of a fault to a cell on the border of another fault.
Finally, as an example of a possible use of synthetic catalogs, an attenuation law has been applied to all the events reported in the synthetic catalog for the production of maps showing the exceedance probability of given values of Peak Ground Acceleration (PGA) on the territory under investigation.
The new version of the simulator code containing the above-mentioned improvements was first applied to a set of the Italian database of seismic sources (DISS 3.2.0), selecting all the faults that are recognized in the Calabria region, for a total of 22 fault segments. The application of our simulation algorithm provides typical features in time, space and magnitude behavior of the seismicity, which can be compared with those of the real observations. Figures 2.8and 2.9show examples of the results obtained in this study.
A temporal feature of the synthetic catalogs obtained from our simulation algorithm was explored by analyzing the statistical distribution of the time by which an event of any magnitude can precede or follow a strong earthquake of M ≥ 6.0. This study was aimed to assess the existence in the synthetic catalogs of some kind of time-dependent occurrence rate as a long-term precursor of strong earthquakes. The analysis was carried out by a stacking technique on the catalog obtained from the 0.25 × 0.25 km discretization starting from a minimum magnitude M = 3.0, and its results are displayed in Figure 2.10. This figure shows an outstanding trend of acceleration of seismic activity in a 150 years period before the strong earthquakes, as well as a sort of quiescence with a slow recovering to the normality after such earthquakes.
In order to explore the potential use of a synthetic catalog obtained by the simulation algorithm for seismic hazard assessment, we adopted the Cornell (1968) method applied to the M ≥ 4.5, 100 ky simulated catalog. The PGA at a dense grid of points covering the territory of the Calabria region was estimated for each earthquake of the catalog through a typical attenuation law (Sabetta-Pugliese 1987):

where M is the earthquake magnitude, d is the epicentral distance, and S 1and S 2are parameters taking into account the soil dynamic features at the site. At each node of the grid we obtained the distribution of the number of times that a given PGA was exceeded in 100 kyrs, and from that, the probability of exceedance of the given PGA in 50 years. The results for PGA = 0.2 g are shown in Figure 2.11, as an example of how the method can work.
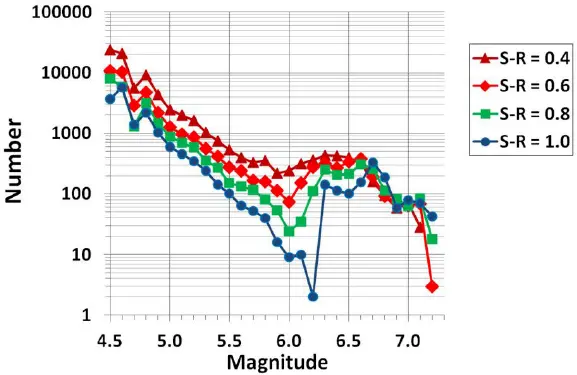
Figure 2.8. a) Magnitude-frequency distribution of the earthquakes in the synthetic catalog obtained from the simulation algorithm described in the text using a discretization of 1 × 1 km and an aspect ratio (A-R) coefficient equal to 2 and various values of the stress reduction (S-R) coefficient (based on Console et al . 2017). b) As in (a), using various values of the aspect ratio (A-R) coefficient and a stress reduction (S-R) coefficient equal to 0.7 (based on Console et al . 2017). For a color version of this figure, see www.iste.co.uk/limnios/statistical.zip
2.3.5. Application to the seismicity of Central Italy
The new version of the simulator code also first applied to another set of the Italian database of seismic sources (DISS 3.2.0), including all the fault systems that are recognized in the Central Apennines, for a total of 24 faults (Console et al . 2018a). One of the main purposes of our application of the simulator to the seismicity of the Central Apennines area was testing whether fault segmentation and characteristic earthquake hypothesis are necessary conditions for modeling, in reasonable way, earthquake patterns observed in real historical records. To show how the un-segmented model of sources used in our simulation can generate realistic seismicity patterns that can be compared with the real seismicity observed in the most recent centuries, we analyzed the complete history of simulated ruptures in a period of 10 kyrs along three faults linked together, along a nearly straight line. For this exercise, we extracted, from a synthetic catalog of 10 kyrs obtained for the complete set of 24 faults, the earthquakes occurring on a fault system including SFS07, SFS08 and SFS09 with a total length of about 170 km (Figure 1 of Console et al . 2018a). The simulator algorithm is not conditioned by the sub-partition of this structure in three faults because their minimum relative distance is shorter than the prefixed limit of 10 km, and ruptures are allowed to propagate from one to another in a unique event.
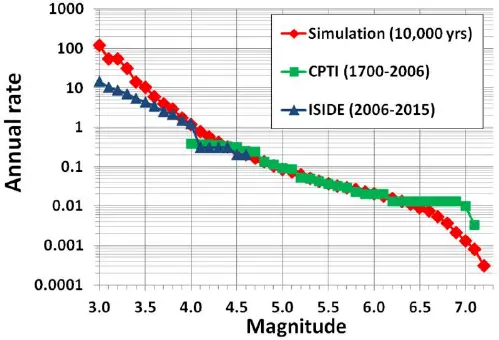
Figure 2.9. Cumulative magnitude-frequency distribution of the earthquakes in the Calabria region. Red diamonds: synthetic catalog obtained from the simulation algorithm described in the text using a discretization of 0.25 × 0.25 km, an aspect ratio (A-R) coefficient equal to 5 and a stress reduction (S-R) coefficient equal to 0.4; green squares: the Italian historical catalog CPTI11 (Catalogo Parametrico dei Terremoti Italiani) (Rovida et al . 2011) for the latest three centuries; blue triangles: the Italian instrumental catalog ISIDe (Italian Seismological Instrumental and Parametric Data-Base) catalog (Mele et al . 2010) for the latest 20 years. All the three series are displayed in the same units (events per year) (based on Console et al . 2017). For a color version of this figure, see www.iste.co.uk/limnios/statistical.zip
Читать дальшеИнтервал:
Закладка:
Похожие книги на «Statistical Methods and Modeling of Seismogenesis»
Представляем Вашему вниманию похожие книги на «Statistical Methods and Modeling of Seismogenesis» списком для выбора. Мы отобрали схожую по названию и смыслу литературу в надежде предоставить читателям больше вариантов отыскать новые, интересные, ещё непрочитанные произведения.


Обсуждение, отзывы о книге «Statistical Methods and Modeling of Seismogenesis» и просто собственные мнения читателей. Оставьте ваши комментарии, напишите, что Вы думаете о произведении, его смысле или главных героях. Укажите что конкретно понравилось, а что нет, и почему Вы так считаете.