Mantle Convection and Surface Expressions
Здесь есть возможность читать онлайн «Mantle Convection and Surface Expressions» — ознакомительный отрывок электронной книги совершенно бесплатно, а после прочтения отрывка купить полную версию. В некоторых случаях можно слушать аудио, скачать через торрент в формате fb2 и присутствует краткое содержание. Жанр: unrecognised, на английском языке. Описание произведения, (предисловие) а так же отзывы посетителей доступны на портале библиотеки ЛибКат.
- Название:Mantle Convection and Surface Expressions
- Автор:
- Жанр:
- Год:неизвестен
- ISBN:нет данных
- Рейтинг книги:4 / 5. Голосов: 1
-
Избранное:Добавить в избранное
- Отзывы:
-
Ваша оценка:
Mantle Convection and Surface Expressions: краткое содержание, описание и аннотация
Предлагаем к чтению аннотацию, описание, краткое содержание или предисловие (зависит от того, что написал сам автор книги «Mantle Convection and Surface Expressions»). Если вы не нашли необходимую информацию о книге — напишите в комментариях, мы постараемся отыскать её.
Mantle Convection and Surface Expressions Volume highlights include:
Perspectives from different scientific disciplines with an emphasis on exploring synergies Current state of the mantle, its physical properties, compositional structure, and dynamic evolution Transport of heat and material through the mantle as constrained by geophysical observations, geochemical data and geodynamic model predictions Surface expressions of mantle dynamics and its control on planetary evolution and habitability The American Geophysical Union promotes discovery in Earth and space science for the benefit of humanity. Its publications disseminate scientific knowledge and provide resources for researchers, students, and professionals.
Mantle Convection and Surface Expressions — читать онлайн ознакомительный отрывок
Ниже представлен текст книги, разбитый по страницам. Система сохранения места последней прочитанной страницы, позволяет с удобством читать онлайн бесплатно книгу «Mantle Convection and Surface Expressions», без необходимости каждый раз заново искать на чём Вы остановились. Поставьте закладку, и сможете в любой момент перейти на страницу, на которой закончили чтение.
Интервал:
Закладка:
Experiments on peridotitic rock compositions found bridgmanite (bm), ferropericlase (fp), and calcium silicate perovskite (cp) as major phases with approximately constant volume fractions of bm:fp:cp ~ 70:20:10 at pressures and temperatures of the lower mantle (Irifune et al., 2010; Kesson et al., 1998; Murakami et al., 2005). Depending on composition and temperature, bridgmanite transforms to the post‐perovskite phase at pressures in excess of 100 GPa corresponding to an approximate depth of 2400 km (Murakami et al., 2005, 2004; Shim et al., 2004; Sun et al., 2018). Since the composition of calcium silicate perovskite remains close to pure CaSiO 3and bridgmanite incorporates virtually all available Al 2O 3, the main compositional variables are the Mg/(Fe+Mg) ratios of bridgmanite and ferropericlase that are coupled through Fe‐Mg exchange reactions. Fe‐Mg exchange between ferropericlase and bridgmanite is sensitive to a large number of thermodynamic parameters including pressure, temperature, composition, oxygen fugacity, and the spin states of Fe 2+and Fe 3+(Badro, 2014). Despite substantial progress in deciphering the effects of these parameters on the Fe‐Mg exchange between bridgmanite and ferropericlase, the variation of the Fe‐Mg exchange coefficient 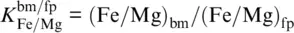 (Badro, 2014) through the lower mantle remains debated. While recent experimental studies found Fe‐Mg exchange coefficients of about 0.5 with no clear trend with increasing pressure between 40 GPa and 100 GPa (Piet et al., 2016; Prescher et al., 2014; Sinmyo & Hirose, 2013), DFT computations suggest generally smaller values that decrease with increasing pressure as a result of the progressing spin transition of Fe 2+in ferropericlase (Muir & Brodholt, 2016; Xu et al., 2017). The Fe‐Mg exchange coefficient for harzburgitic rocks seems to be closer to 0.2 and to decrease with increasing pressure (Auzende et al., 2008; Badro, 2014; Piet et al., 2016; Sakai et al., 2009; Sinmyo et al., 2008; Xu et al., 2017). Figure 3.6a summarizes experimental and computational findings on Fe‐Mg exchange between bridgmanite and ferropericlase.
For basaltic compositions that intend to represent recycled oceanic crust, experimental results suggest modal proportions of the major phases bridgmanite (bm), calcium silicate perovskite (cp), CF phase (cf), and stishovite (st) of bm:cp:cf:st ~ 45:30:15:10 throughout most of the lower mantle (Hirose et al., 2005, 1999; Ono et al., 2001; Perrillat et al., 2006; Ricolleau et al., 2010). At pressures between 25 GPa and 40 GPa, the NAL phase has been found to coexist with this assemblage but seems to become destabilized towards higher pressures (Perrillat et al., 2006; Ricolleau et al., 2010). Figure 3.6b shows exchange coefficients for Fe‐Mg and Al‐Mg exchange between bridgmanite and the CF phase as computed from experimentally observed mineral compositions for the assemblage bm‐cp‐cf‐st in basaltic bulk compositions. Although it appears difficult to assign robust trends of mineral compositions with changes in pressure or temperature, iron tends to be equally distributed between bridgmanite and the CF phase while aluminum seems to preferentially partition into the CF phase. The wide spread in experimentally observed mineral compositions is also reflected in the bridgmanite compositions shown in Figure 3.3. Clearly, more experiments are needed to better understand element partitioning and mineral compositions in peridotitic and metabasaltic rocks at conditions of the lower mantle.
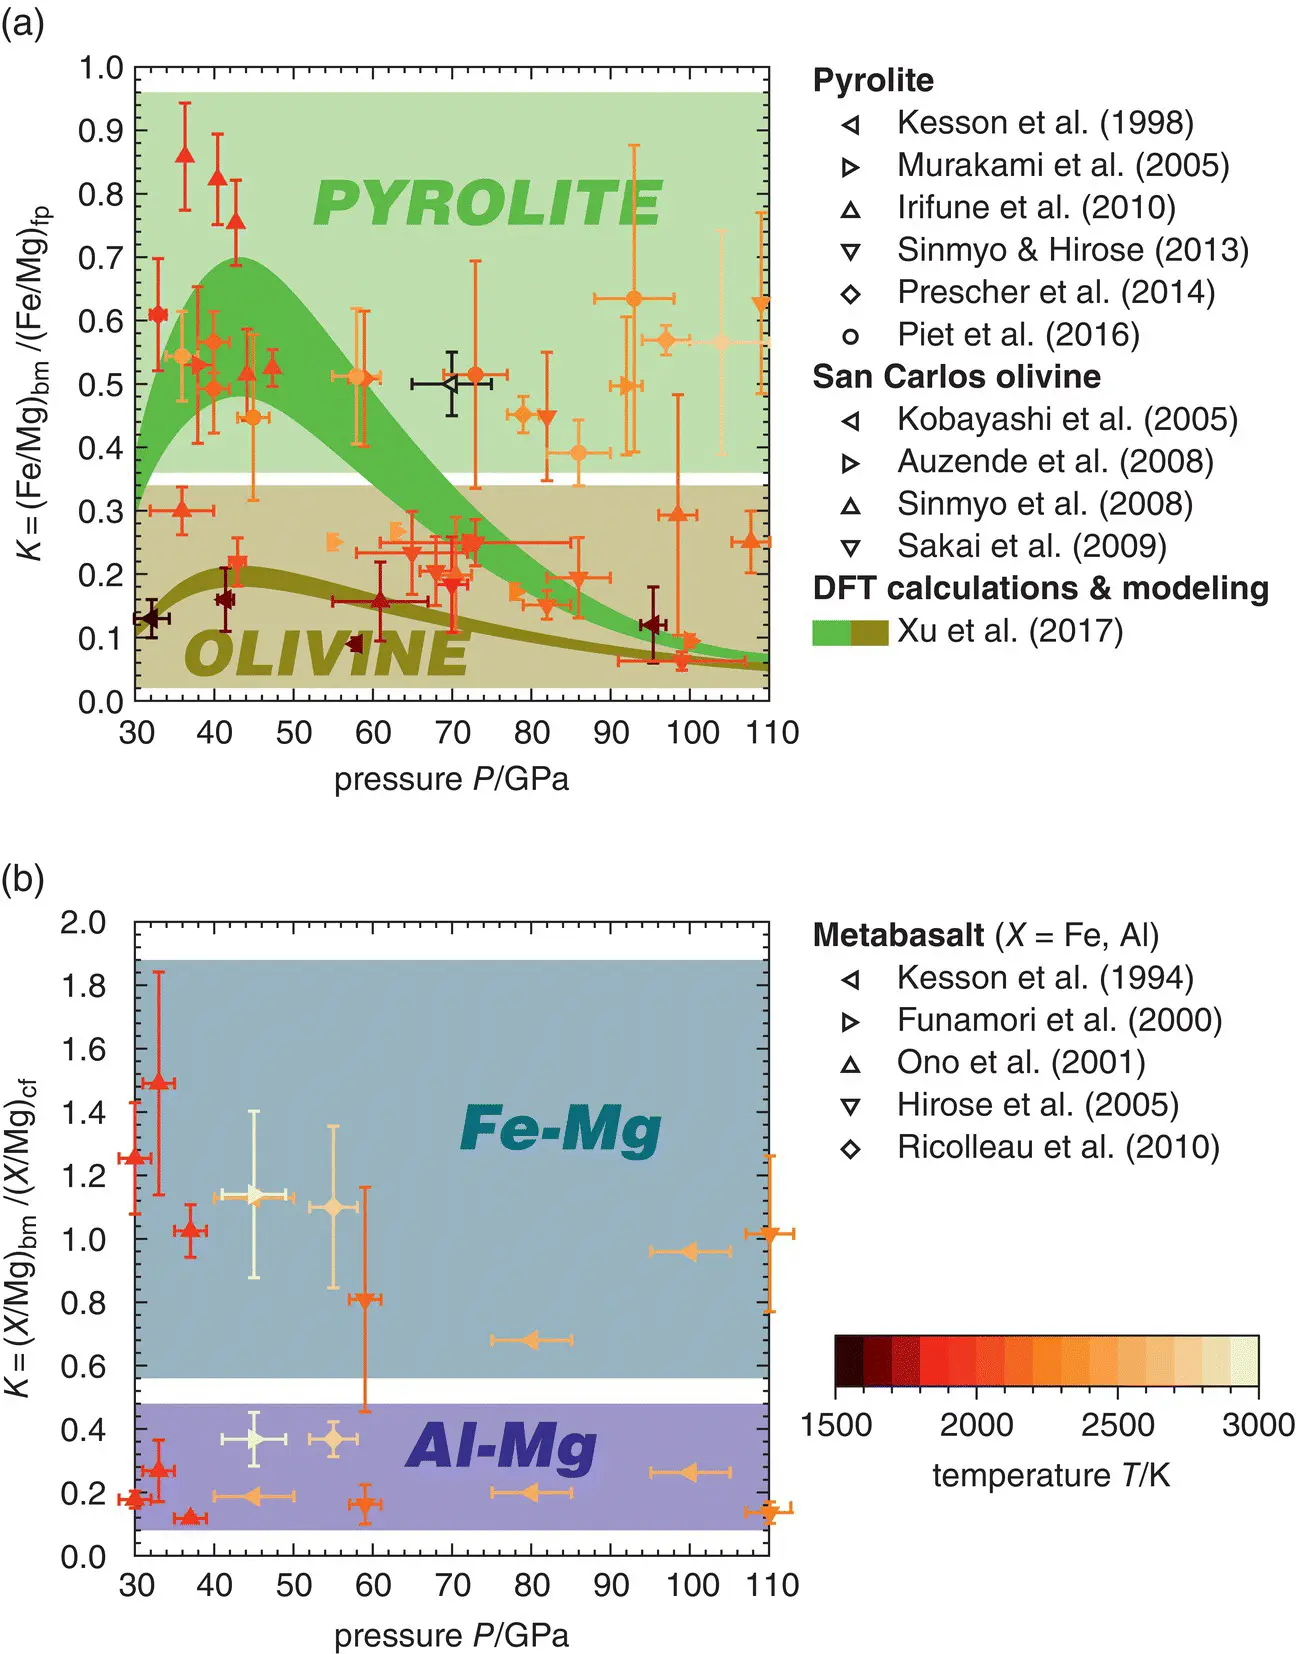
Figure 3.6 Exchange coefficients for Fe‐Mg exchange between bridgmanite and ferropericlase in peridotitic bulk compositions (a) and for Fe‐Mg and Al‐Mg exchange between bridgmanite and the CF phase in basaltic bulk compositions (b). Color shading indicates the relevant parts of each diagram for different bulk compositions (a) or exchange coefficients (b). Note the reduction in the Fe‐Mg exchange coefficient between bridgmanite and ferropericlase with increasing pressure as predicted by thermodynamic modeling based on DFT computations.
To evaluate the impact of variations in rock composition and thermal state of the lower mantle on seismic properties, I computed P‐ and S‐ wave velocities for pyrolite, harzburgite, and metabasalt over relevant pressure and temperature intervals. Recent experimental and computational results on the high‐pressure and high‐temperature elasticity of lower‐mantle phases are compiled in Table 3.1. This compilation aims at reflecting recent progress on individual mineral phases and does not represent an internally consistent data set in a thermodynamic sense. If not given in the original publication, finite‐strain and thermal parameters were determined by fitting experimental data to the finite‐strain formalism of Stixrude & Lithgow‐Bertelloni (2005). I included the effect of spin transitions of Fe 2+in ferropericlase and of Fe 3+in bridgmanite and in the CF phase using the parametrization introduced in Section 3.7with parameters given in Figures 3.5a–c. The effect of the ferroelastic phase transition from stishovite to CaCl 2‐type SiO 2was modeled based on the reanalysis of powder diffraction data (Andrault et al., 2003) using Landau theory as given by Buchen et al. (2018a). The experimentally determined phase boundary between stishovite and CaCl 2‐type SiO 2with a Clapeyron slope of dP / dT = 15.5 MPa K –1(Fischer et al., 2018) was used to constrain the temperature dependence of the Landau parameter A . Figure 3.7shows P‐ and S‐ wave velocities for each mineral composition in Table 3.1along a typical adiabatic compression path.
Table 3.1 Finite‐strain parameters for mineral phases of the lower mantle.
References: [1] Fiquet et al. (2000), [2] Murakami et al. (2007), [3] Zhang et al. (2013), [4] Murakami et al. (2012), [5] Chantel et al. (2012), [6] Fu et al. (2018), [7] Jackson et al. (2005), [8] Kurnosov et al. (2017), [9] Sinogeikin & Bass (2000), [10] Murakami et al. (2009), [11] Yang et al. (2016), [12] Yang et al. (2015), [13] Thomson et al. (2019), [14] Mookherjee (2011), [15] Stixrude & Lithgow‐Bertelloni (2011), [16] Imada et al. (2012), [17] Dai et al. (2013), [18] Wu et al. (2017), [19] Andrault et al. (2003), [20] Jiang et al. (2009), [21] Gréaux et al. (2016), [22] Fischer et al. (2018), [23] Buchen et al. (2018a).
| Mineral/Phase | Formula | Volume | Bulk modulus | Shear modulus | Quasi‐harmonic parameters | References | |||||
|---|---|---|---|---|---|---|---|---|---|---|---|
| V 0(Å 3) | K 0(GPa) | K 0 ' | G 0(GPa) | G 0 ' | θ 0(K) | γ 0 | q 0 | η S0 | |||
| bridgmanite | MgSiO 3 | 162.27(1) | 253(9) | 3.9(2) | 173(2) | 1.56(4) | 905.9 | 1.44 | 1.09 | 2.2(2) | [1,2,3,4] |
| (Mg 0.95Fe 0.05)SiO 3 | 163.45(2) | 247(2) S | 3.6(1) | 168.3(9) | 2.02(3) | 905.9 | 1.44 | 1.09 | 2.2 | [3,4,5 * ,6 * ] | |
| (Mg 0.96Al 0.04)(Si 0.96Al 0.04)O 3 | 163.21(1) | 252(5) S | 3.7(3) | 166(1) | 1.57(5) | 905.9 | 1.44 | 1.09 | 2.2 | [3,4,7] | |
| (Mg 0.9Fe 0.1)(Si 0.9Al 0.1)O 3 | 162.96(2) | 250.8(4) S | 3.44(3) | 159.7(2) | 2.05(2) | 905.9 | 1.44 | 1.09 | 2.2 | [3,4,8] | |
| ferropericlase | MgO | 74.68(2) | 163(1) S | 3.8(1) | 131(1) | 1.92(2) | 770 | 1.5 | 2.8 | 3.0 | [9,10,11 * ] |
| (Mg 0.92Fe 0.08)O | 74.07(1) | 169(2) S | 4.01(7) | 126(2) | 2.08(3) | 770 | 1.5 | 2.8(6) | 3.0(3) | [11 * ,12 * ] | |
| Ca silicate perovskite | CaSiO 3 | 45.57(2) | 248(3) | 3.6(1) | 107(1) | 1.66(22) | 771(90) | 1.67(4) | 1.1(2) | 3.3 | [13] |
| Ca ferrite‐type phase | MgAl 2O 4 | 236.07 | 217 | 3.7 | 133 | 1.7 | 840(20) | 1.3(3) | 1(1) | 2(1) | [14,15] |
| FeAl 2O 4 | 247.49 | 217 | 3.7 | 133 | 1.7 | 840 | 1.3 | 1 | 2 | [14,15] | |
| Na 0.4Mg 0.6Al 1.6Si 0.4O 4 | 239.9(37) | 221(2) | 4 | 129.65(6) | 2.34(1) | 840 | 1.3 | 1 | 2 | [15,16,17] | |
| Na 0.88Al 0.99Fe 0.13Si 0.94O 4 | 242.79(27) | 205(6) | 3.6(2) | 130 | 2 | 840 | 1.3 | 1 | 2 | [15,18 * ] | |
| stishovite | SiO 2 | 46.51(2) | 320(2) | 4 | 264(2) | 1.90(1) | 1100 | 1.7 | 5.7(3) | 2.9(2) | [19,20,21 * ,22,23] |
| CaCl 2‐type SiO 2 | SiO 2 | 47.54(18) | 238(6) | 4.82(2) | 264(2) | 2.23(1) | 1100 | 1.7 | 5.7 | 2.9 | [19,20,21 * ,22,23] |
Values in italics were estimated or adopted from other compositions/polymorphs of the same phase/compound.
Читать дальшеИнтервал:
Закладка:
Похожие книги на «Mantle Convection and Surface Expressions»
Представляем Вашему вниманию похожие книги на «Mantle Convection and Surface Expressions» списком для выбора. Мы отобрали схожую по названию и смыслу литературу в надежде предоставить читателям больше вариантов отыскать новые, интересные, ещё непрочитанные произведения.


Обсуждение, отзывы о книге «Mantle Convection and Surface Expressions» и просто собственные мнения читателей. Оставьте ваши комментарии, напишите, что Вы думаете о произведении, его смысле или главных героях. Укажите что конкретно понравилось, а что нет, и почему Вы так считаете.