Mantle Convection and Surface Expressions
Здесь есть возможность читать онлайн «Mantle Convection and Surface Expressions» — ознакомительный отрывок электронной книги совершенно бесплатно, а после прочтения отрывка купить полную версию. В некоторых случаях можно слушать аудио, скачать через торрент в формате fb2 и присутствует краткое содержание. Жанр: unrecognised, на английском языке. Описание произведения, (предисловие) а так же отзывы посетителей доступны на портале библиотеки ЛибКат.
- Название:Mantle Convection and Surface Expressions
- Автор:
- Жанр:
- Год:неизвестен
- ISBN:нет данных
- Рейтинг книги:4 / 5. Голосов: 1
-
Избранное:Добавить в избранное
- Отзывы:
-
Ваша оценка:
Mantle Convection and Surface Expressions: краткое содержание, описание и аннотация
Предлагаем к чтению аннотацию, описание, краткое содержание или предисловие (зависит от того, что написал сам автор книги «Mantle Convection and Surface Expressions»). Если вы не нашли необходимую информацию о книге — напишите в комментариях, мы постараемся отыскать её.
Mantle Convection and Surface Expressions Volume highlights include:
Perspectives from different scientific disciplines with an emphasis on exploring synergies Current state of the mantle, its physical properties, compositional structure, and dynamic evolution Transport of heat and material through the mantle as constrained by geophysical observations, geochemical data and geodynamic model predictions Surface expressions of mantle dynamics and its control on planetary evolution and habitability The American Geophysical Union promotes discovery in Earth and space science for the benefit of humanity. Its publications disseminate scientific knowledge and provide resources for researchers, students, and professionals.
Mantle Convection and Surface Expressions — читать онлайн ознакомительный отрывок
Ниже представлен текст книги, разбитый по страницам. Система сохранения места последней прочитанной страницы, позволяет с удобством читать онлайн бесплатно книгу «Mantle Convection and Surface Expressions», без необходимости каждый раз заново искать на чём Вы остановились. Поставьте закладку, и сможете в любой момент перейти на страницу, на которой закончили чтение.
Интервал:
Закладка:

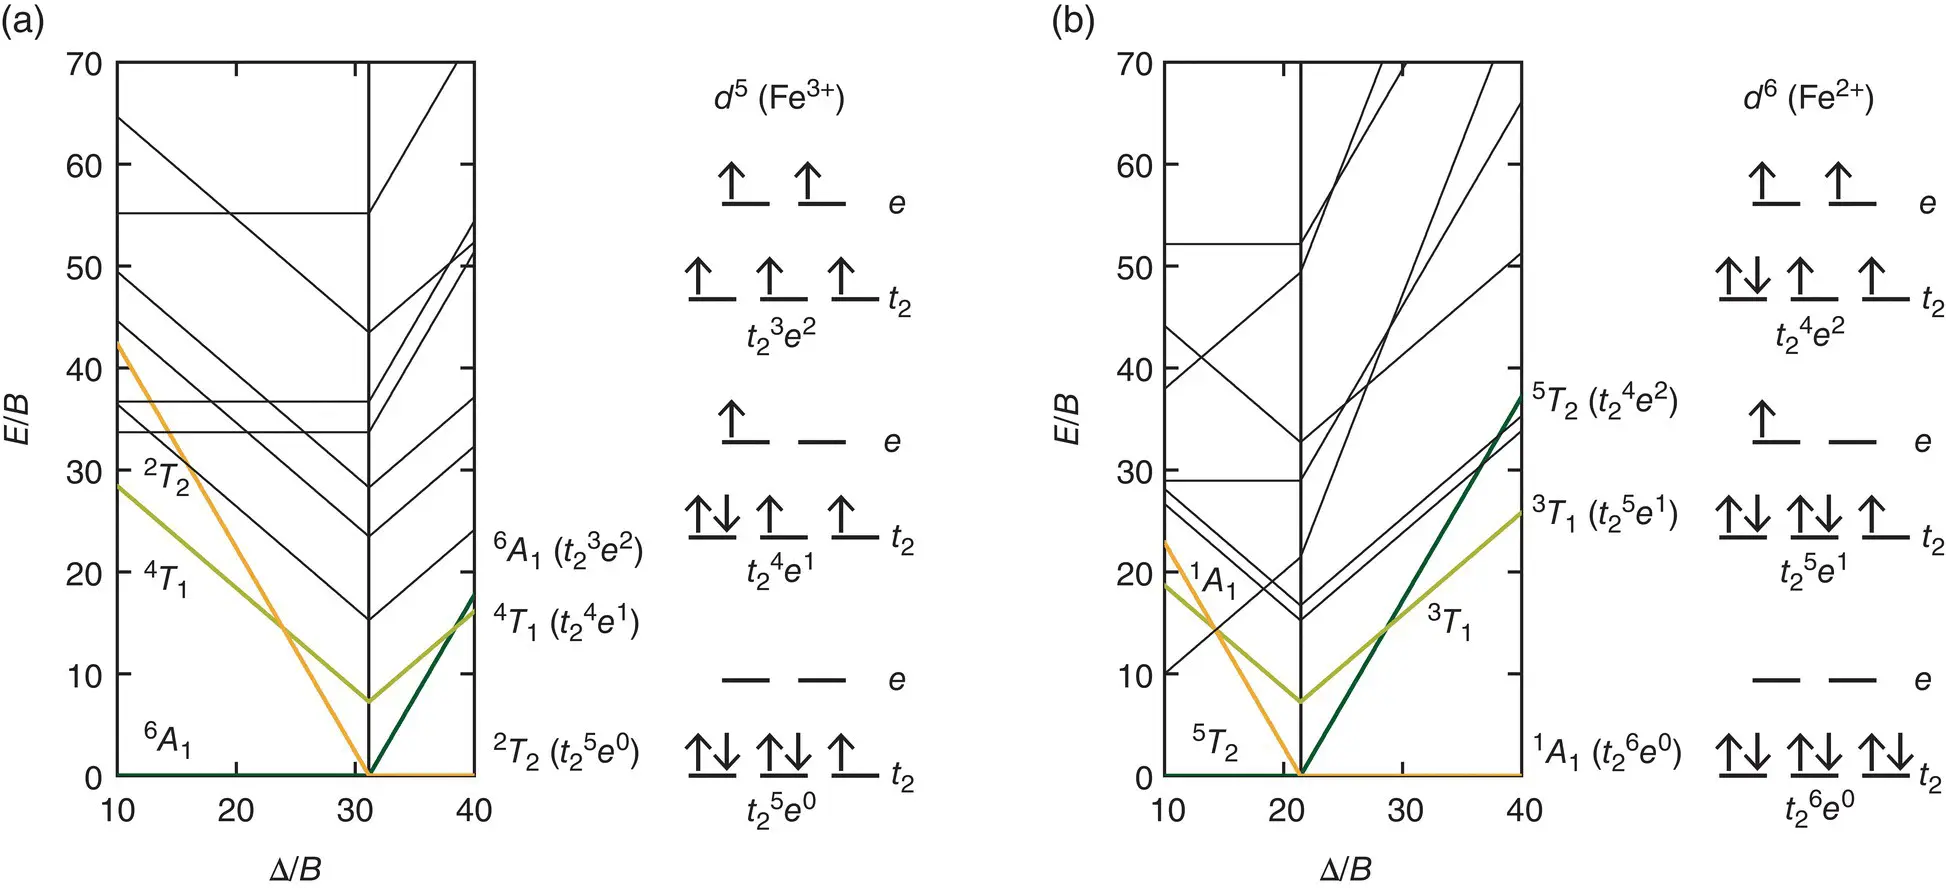
Figure 3.4 Energy diagrams for multi‐electron states that arise from the 3 d electron configurations d 5(Fe 3+) (a) and d 6(Fe 2+) (b) in the limit of strong octahedral crystal fields. Note the change in electronic ground state for each electron configuration when the ratio Δ/ B reaches the value marked by a vertical line. The distributions of d electrons over the crystal‐field orbitals t 2and e are illustrated for the three states that have the lowest energies at the change in electronic ground state.
At T > 0, and in particular at temperatures of Earth’s mantle, the d electron configuration can be thermally excited into states of higher energies. The thermal population of higher energy states becomes most important when the energies of other states approach the energy of the ground state, for example, as a result of compression. A spin transition results from a compression‐induced change of the electronic ground state from a high‐spin to a low‐spin state ( Figure 3.4). At finite temperatures, the broadening of the transition reflects the incipient population of the low‐spin state before and the decaying population of the high‐spin state after their energies cross over as long as the energies of both states remain close enough to allow for thermally induced transitions between both states (Holmström & Stixrude, 2015; Sturhahn et al., 2005; Tsuchiya et al., 2006). However, states other than the high‐spin or low‐spin state may get close enough in energy to the ground state to become thermally populated by a significant fraction of d electrons. The thermal distribution of electrons over accessible multi‐electron states contributes to the overall configurational entropy. The excess contribution to the Helmholtz free energy per transition metal cation that results from compression‐ and temperature‐induced changes in the occupation of electronic states can then be identified as:

where Δ ϕ = ϕ ( V , T ) − ϕ 0( V 0, T 0) are the changes in the fractions ϕ of d electrons that occupy each electronic state at a given volume and temperature with respect to the fractions ϕ 0at ambient conditions. Note that the configurational entropy term is multiplied by the number d of d electrons per transition metal cation. The fraction of d electrons that occupy a given state can be found by applying the equilibrium condition ( ∂F EL/ ∂n i) V,T,N= 0 to a micro‐canonical ensemble with the absolute numbers n i= ϕ i N of electrons in each state and the total number N of electrons (Sturhahn et al., 2005):
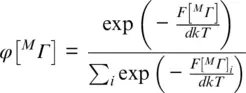
The denominator sums over all multi‐electron states being considered.
The excess contributions to pressure and bulk modulus then follow from the definitions:
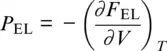
and
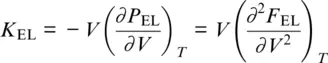
All excess quantities need to be multiplied by the number and fraction of crystallographic sites that are occupied by the transition metal cation.
The parametrization of spin transitions presented above builds on the formulation proposed by Sturhahn et al. (2005) and resembles earlier attempts to predict the effect of spin transitions in Fe 2+on thermodynamic properties of mantle minerals (Badro et al., 2005; Gaffney, 1972; Gaffney & Anderson, 1973; Ohnishi, 1978). Unlike these forward modeling approaches, I will use the formulation here in a semi‐empirical way with adjustable parameters that will be constrained by experimental observations. In contrast to formulations based on the Gibbs free energy with pressure as variable and elastic compliances as parameters that have proven useful in describing the results of DFT computations (Shukla et al., 2016; Wentzcovitch et al., 2009; Wu et al., 2013), a formulation of excess contributions in terms of volume and temperature is more consistent with finite‐strain theory based on the assumption of homogeneous and isotropic finite strain and can, in principle, be generalized to evaluate the effect on individual components of the elastic stiffness tensor and hence on the shear modulus. The impact of spin transitions on the shear modulus, however, appears to be minor (Fu et al., 2018; Marquardt et al., 2009b; Shukla et al., 2016; Wu et al., 2013). Note that by accounting for changes in the electronic configurations in terms of excess properties it is no longer necessary to derive sets of finite‐strain parameters for each individual electronic configuration as required by earlier formulations based on high‐spin and low‐spin states only (Chen et al., 2012; Speziale et al., 2007; Wu et al., 2013, 2009), since the excess contributions are simply added to the (cold) elastic and thermal contributions. Although I assume here that transition metal cations with different electronic configurations mix ideally among each other and with other cations, it is in principle possible to add further terms to account for nonideal mixing behavior and interactions between transition metal cations (Holmström and Stixrude, 2015; Ohnishi and Sugano, 1981; Sturhahn et al., 2005). To some extent and for low concentrations of transition metal cations, deviations from ideal mixing will be captured by the semi‐empirical parameters when fit to experimental data.
By taking into account the three electronic states with lowest energies for ratios Δ/ B close to the compression‐induced change in electronic ground state for ferrous iron, Fe 2+( d 6), and ferric iron, Fe 3+( d 5), in octahedral coordination, i.e., 5 T 2, 1 A 1, and 3 T 1for Fe 2+and 6 A 1, 2 T 2, and 4 T 1for Fe 3+(Tanabe & Sugano, 1954a, 1954b), I analyzed recent experimental result on the elastic properties of ferropericlase (Yang et al., 2015), Fe 3+‐bearing bridgmanite (Chantel et al., 2012; Fu et al., 2018), and Fe 3+‐bearing CF phase (Wu et al., 2017) across their respective spin transitions. When fitting experimental data, I assumed a constant ratio C / B = 4.73 (Krebs & Maisch, 1971; Lehmann & Harder, 1970; Tanabe & Sugano, 1954b) and consequently set b = c . The crystal‐field splitting of Fe 2+and Fe 3+in octahedral coordination in periclase and corundum, respectively, has been derived from optical spectroscopy (Burns, 1993; Krebs and Maisch, 1971; Lehmann and Harder, 1970) and from early quantum‐mechanical computations (Sherman, 1991, 1985). Hence, I assumed Δ 0= 10800 cm –1for Fe 2+in ferropericlase (Burns, 1993; Sherman, 1991) and adopted Δ 0= 14750 cm –1for Fe 3+in corundum as approximation for Fe 3+in bridgmanite and in the CF phase (Krebs & Maisch, 1971; Lehmann & Harder, 1970; Sherman, 1985). Similarly, the Racah B 0parameter at ambient conditions has been determined for octahedrally coordinated Fe 3+in corundum from optical spectra (Krebs & Maisch, 1971; Lehmann & Harder, 1970) and was set to B 0= 655 cm –1for Fe 3+in the CF phase. The volume exponent δ was initially set to δ = 5 as suggested by the point charge model. The exponents c = b and, when required, δ and B 0were treated as adjustable parameters in addition to the finite‐strain parameters that describe the compression‐induced changes of elastic moduli without excess contributions.
Читать дальшеИнтервал:
Закладка:
Похожие книги на «Mantle Convection and Surface Expressions»
Представляем Вашему вниманию похожие книги на «Mantle Convection and Surface Expressions» списком для выбора. Мы отобрали схожую по названию и смыслу литературу в надежде предоставить читателям больше вариантов отыскать новые, интересные, ещё непрочитанные произведения.


Обсуждение, отзывы о книге «Mantle Convection and Surface Expressions» и просто собственные мнения читателей. Оставьте ваши комментарии, напишите, что Вы думаете о произведении, его смысле или главных героях. Укажите что конкретно понравилось, а что нет, и почему Вы так считаете.