Mantle Convection and Surface Expressions
Здесь есть возможность читать онлайн «Mantle Convection and Surface Expressions» — ознакомительный отрывок электронной книги совершенно бесплатно, а после прочтения отрывка купить полную версию. В некоторых случаях можно слушать аудио, скачать через торрент в формате fb2 и присутствует краткое содержание. Жанр: unrecognised, на английском языке. Описание произведения, (предисловие) а так же отзывы посетителей доступны на портале библиотеки ЛибКат.
- Название:Mantle Convection and Surface Expressions
- Автор:
- Жанр:
- Год:неизвестен
- ISBN:нет данных
- Рейтинг книги:4 / 5. Голосов: 1
-
Избранное:Добавить в избранное
- Отзывы:
-
Ваша оценка:
Mantle Convection and Surface Expressions: краткое содержание, описание и аннотация
Предлагаем к чтению аннотацию, описание, краткое содержание или предисловие (зависит от того, что написал сам автор книги «Mantle Convection and Surface Expressions»). Если вы не нашли необходимую информацию о книге — напишите в комментариях, мы постараемся отыскать её.
Mantle Convection and Surface Expressions Volume highlights include:
Perspectives from different scientific disciplines with an emphasis on exploring synergies Current state of the mantle, its physical properties, compositional structure, and dynamic evolution Transport of heat and material through the mantle as constrained by geophysical observations, geochemical data and geodynamic model predictions Surface expressions of mantle dynamics and its control on planetary evolution and habitability The American Geophysical Union promotes discovery in Earth and space science for the benefit of humanity. Its publications disseminate scientific knowledge and provide resources for researchers, students, and professionals.
Mantle Convection and Surface Expressions — читать онлайн ознакомительный отрывок
Ниже представлен текст книги, разбитый по страницам. Система сохранения места последней прочитанной страницы, позволяет с удобством читать онлайн бесплатно книгу «Mantle Convection and Surface Expressions», без необходимости каждый раз заново искать на чём Вы остановились. Поставьте закладку, и сможете в любой момент перейти на страницу, на которой закончили чтение.
Интервал:
Закладка:
The fitting results are shown in Figures 3.5a–c and demonstrate that the semi‐empirical model captures the softening of the bulk modulus of ferropericlase (Yang et al., 2015), the dip in P‐ wave velocities of Fe 3+‐bearing bridgmanite (Fu et al., 2018), and the segment of enhanced volume reduction in the compression curve of the CF phase (Wu et al., 2017) that have been interpreted to result from compression‐induced changes in the electronic structures of ferrous and ferric iron. The Racah B 0parameter found for Fe 2+in ferropericlase is compatible with values derived from optical spectroscopy (Burns, 1993; Tanabe & Sugano, 1954b). For all three data sets, −3 < b = c < −2 indicating a decrease of the Racah B parameter with compression as suggested by results from high‐pressure optical spectroscopy (Abu‐Eid & Burns, 1976; Keppler et al., 2007; Stephens & Drickamer, 1961a, 1961b). It is important to note, however, that the exponents b = c are positively correlated with the exponent δ that was fixed at δ = 5 for ferropericlase and the CF phase. A combination of slightly higher values for δ with less negative values of b and c can explain the observations equally well, suggesting that the difference δ − b might be more meaningful than the individual parameters. The P‐ wave velocity data for bridgmanite required significantly higher values for the exponent δ and the Racah B 0parameter than suggested by the point charge model or optical spectroscopy. The very large exponent δ for bridgmanite might reflect the different compression behaviors of A and B sites in the perovskite crystal structure that might not be related in a simple way to the compression mechanism of the crystal structure as a whole and to the ratio V 0/ V of unit cell volumes (Boffa Ballaran et al., 2012; Glazyrin et al., 2014). Distortions of the coordination environment away from an ideal octahedron will also result in crystal‐field parameters that deviate from their values for more regular and symmetric arrangements of coordinating anions. However, the general consistency between crystal‐field parameters from optical spectroscopy when used in the semi‐empirical model for electronic excess properties and high‐pressure experimental data on elastic properties, in particular for close‐packed oxide structures, may motivate further testing and development of the model.
Figures 3.5d–f show the predicted fractions ϕ of d electrons that occupy each of the considered multi‐electron states for Fe 2+in ferropericlase and Fe 3+in bridgmanite and in the CF phase along different adiabatic compression paths. The change in electronic ground states from 5 T 2(high spin) to 1 A 1(low spin) for Fe 2+and from 6 A 1(high spin) to 2 T 2(low spin) for Fe 3+is gradual and broadens with increasing temperatures as suggested earlier (Holmström & Stixrude, 2015; Lin et al., 2007; Sturhahn et al., 2005; Tsuchiya et al., 2006). The crystal‐field model outlined above, however, predicts additional broadening that results from thermal population of the higher energy states 3 T 1for Fe 2+and 4 T 1for Fe 3+. At realistic mantle temperatures, these states are predicted to host up to 25% of d electrons. Population of these states will reduce the effect of spin transitions on mineral densities and elastic properties by diluting the contrasts in properties between pure high‐spin and low‐spin states. The spin transition of Fe 2+in ferropericlase appears to be most susceptible to thermal broadening while spin transitions of Fe 3+in bridgmanite and in the CF phase remain somewhat sharper even at high temperatures.
The effect of spin transitions on P‐ wave velocities is shown in Figures 3.5g–i as relative velocity reductions along typical adiabatic compression paths. In qualitative agreement with results of DFT computations for ferropericlase and Fe 3+‐bearing bridgmanite (Shukla et al., 2016; Wentzcovitch et al., 2009; Wu et al., 2013), both the pressure interval and the pressure of maximum P‐ wave velocity reduction increase with temperature. Absolute velocity reductions and their exact pressure intervals at high temperatures as predicted by DFT computations, however, seem to differ from those predicted by the semi‐empirical crystal‐field model. Figures 3.5g–i also show how ignoring the population of the higher energy states 3 T 1for Fe 2+and 4 T 1for Fe 3+would overestimate P‐ wave velocity reductions at realistic mantle temperatures. Although I considered only one additional state for each Fe 2+and Fe 3+, more high‐energy states might become populated at relevant temperatures, further depleting high‐spin and low‐spin ground states. Experiments at combined high pressures and high temperatures are needed to directly assess the thermal broadening of spin transitions and their effects on mineral elasticity. Since the volume changes that result from spin transitions can be subtle, in particular at high temperatures and for typical iron contents of mantle minerals (Komabayashi et al., 2010; Mao et al., 2011), experiments that constrain elastic properties in addition to volume might be best suited to resolve the impact of spin transitions on sound wave velocities at high temperatures.
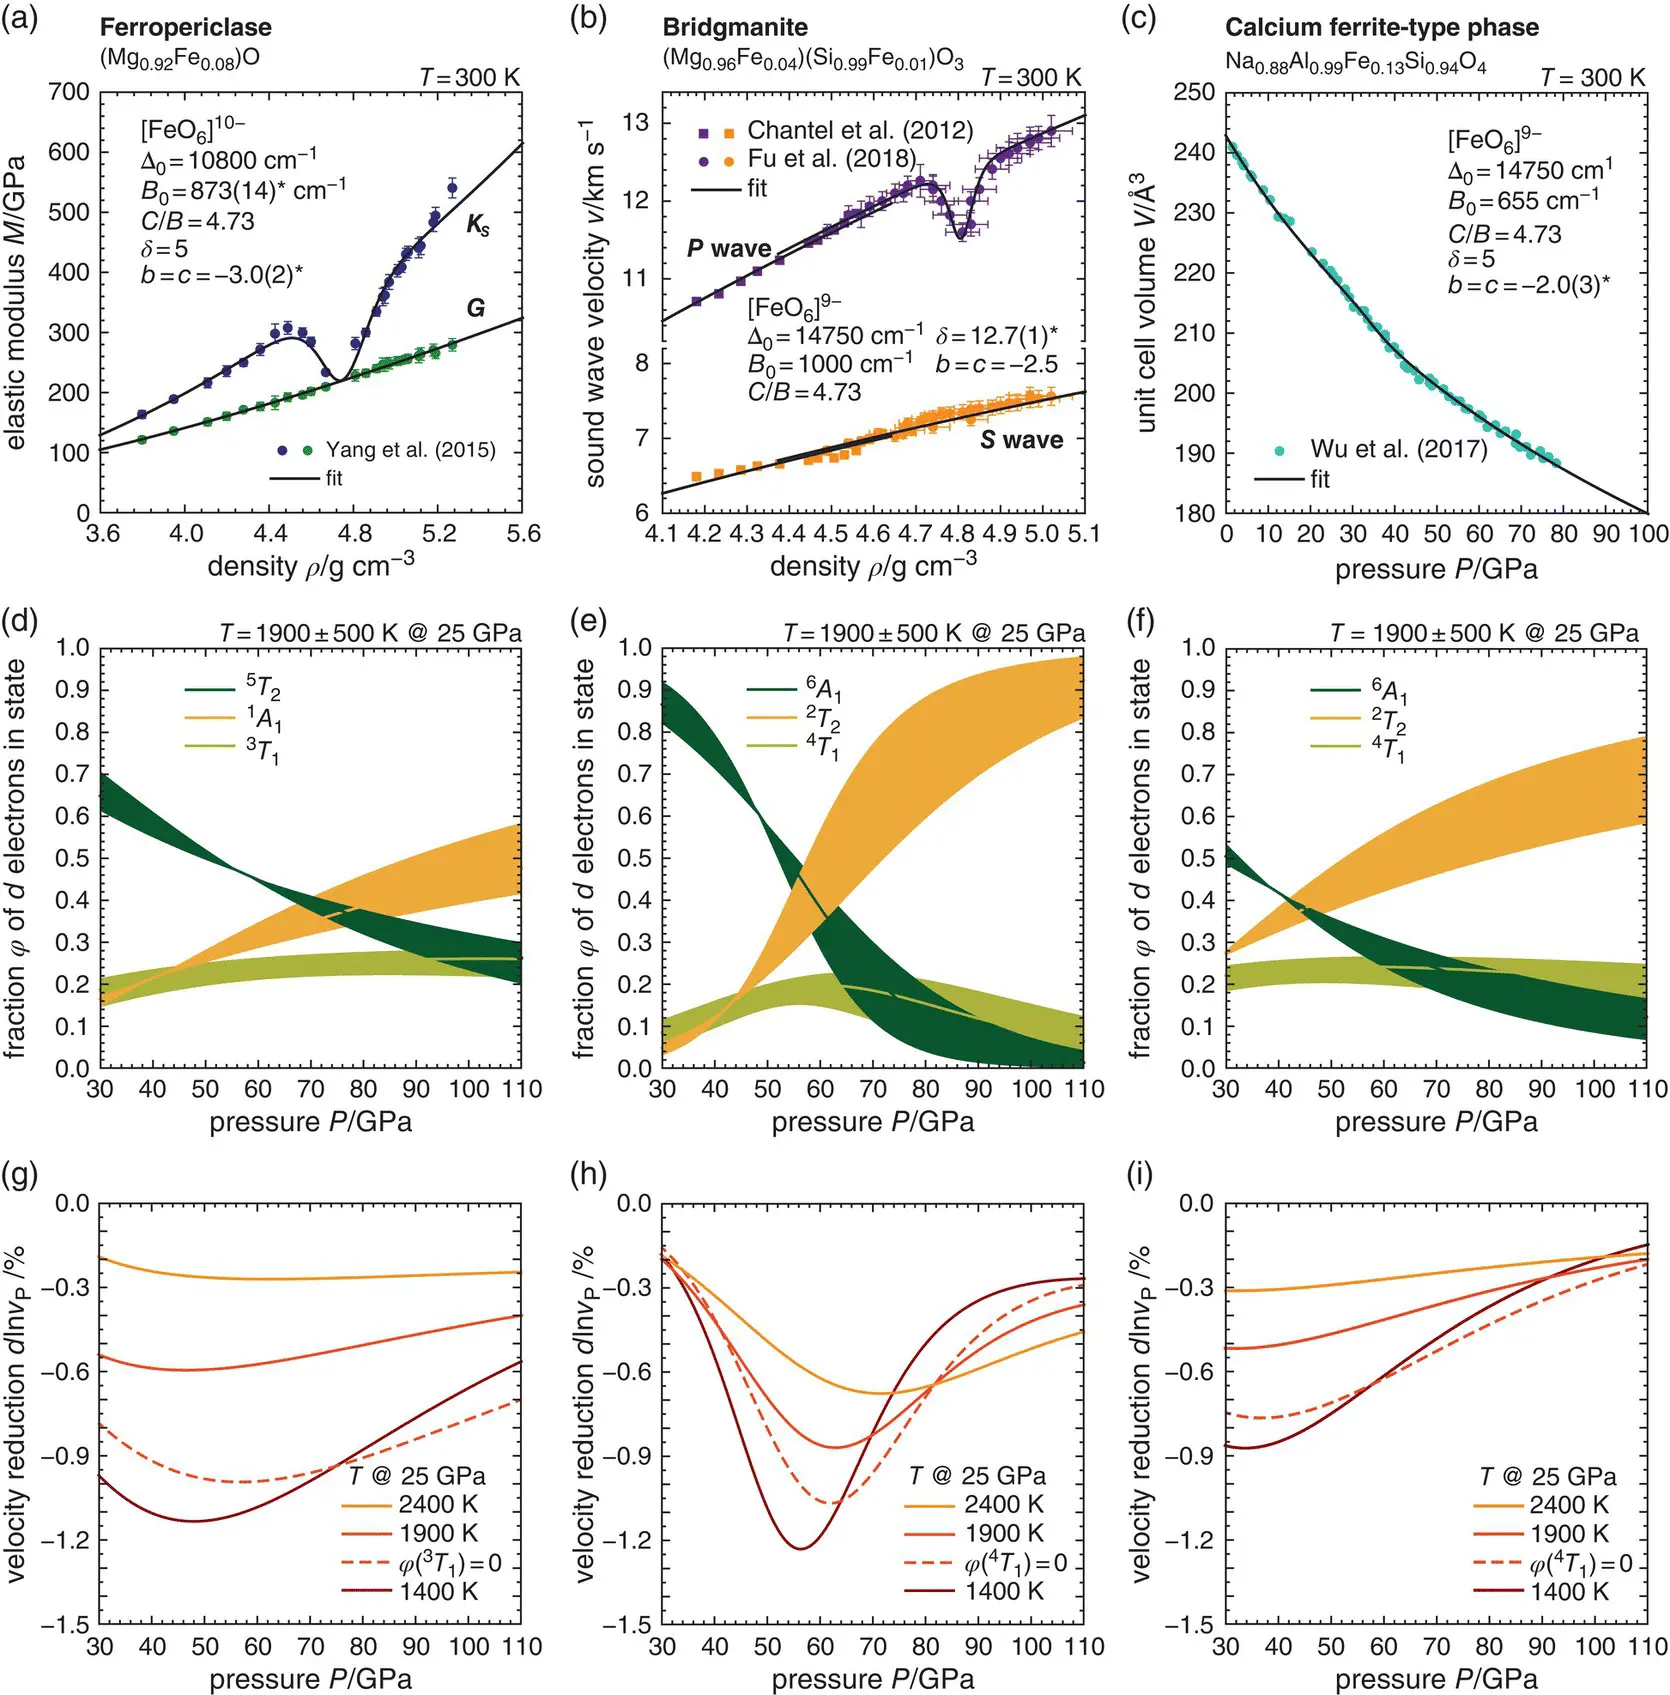
Figure 3.5 (a–c) Reanalysis of elastic moduli of ferropericlase (a), sound wave velocities of bridgmanite (b), and compression data on the CF phase (c) across spin transitions of ferrous (a) and ferric (b,c) iron. Respective data are from Yang et al. (2015) (a), Chantel et al. (2012), and Fu et al. (2018) (b), and Wu et al. (2017) (c). Bold black curves show the results of fitting a semi‐empirical crystal‐field model to the data as explained in the text with the respective crystal‐field parameters given in each panel. The values of crystal‐field parameters that were free to vary during fitting are marked with an asterisk (*). For bridgmanite, data of Chantel et al. (2012) and Fu et al. (2018) have been analyzed together to better constrain pressure derivatives of elastic moduli. The offset between both data sets arises from slightly different estimates for densities as reported in both studies. (d–f) Fractions of d electrons in multi‐electron states across spin transitions of Fe 2+in ferropericlase (d), Fe 3+in bridgmanite (on B site) (e), and Fe 3+in the CF phase (f) as predicted by the semi‐empirical crystal‐field model and along typical adiabatic compression paths (see Figure 3.8). Shading indicates differences in fractions that result from starting adiabatic compression at temperatures 500 K above and below 1900 K at 25 GPa. (g–i) P‐ wave velocity reductions that result from spin transitions of Fe 2+in ferropericlase (g), Fe 3+in bridgmanite (on B site) (h), and Fe 3+in the CF phase (i) as predicted by the semi‐empirical crystal‐field model and along adiabatic compression paths starting at 1400 K, 1900 K, and 2400 K at 25 GPa (see Figure 3.8). The dashed curves show P‐ wave velocity reductions along the central compression path (1900 K at 25 GPa) when the population of a third multi‐electron state with intermediate spin multiplicity is ignored.
3.8 EARTH’S LOWER MANTLE
Seismic tomography shows lateral variations in P‐ and S‐ wave velocities at all depths of the lower mantle and across length scales that are compatible with changes in temperature, chemical composition, and phase assemblage as well as combinations thereof (Durand et al., 2017; Hosseini et al., 2020; Koelemeijer et al., 2016). Scattering of seismic waves in the lower mantle, in contrast, points to changes in the elastic properties of the mantle over length scales that are commonly interpreted to be too short to arise from thermal gradients alone and require compositional heterogeneities or phase changes (Frost et al., 2017; Kaneshima & Helffrich, 2009; Waszek et al., 2018). Lateral and local variations are superimposed on the monotonous increase of seismic velocities that dominates global seismic reference models at depths between 800 km and 2400 km (Dziewonski & Anderson, 1981; Kennett et al., 1995; Kennett & Engdahl, 1991). The seismic structure of the upper mantle and transition zone can be compared with the results of mineral‐physical models (Cammarano et al., 2009; Cobden et al., 2008; Xu et al., 2008) that are based on internally consistent thermodynamic databases (Holland et al., 2013; Stixrude & Lithgow‐Bertelloni, 2011). For the lower mantle and depths in excess of 800 km, however, these databases are less reliable since both chemical compositions and elastic properties of relevant mantle minerals are less well constrained as discussed in Section 3.6for bridgmanite. Moreover, existing thermodynamic databases do not include the effects of continuous phase transitions, such as the ferroelastic phase transition from stishovite to CaCl 2‐type SiO 2and spin transitions, on elastic properties that are expected to affect seismic velocities in the lower mantle. This section focuses on seismic properties of relevant rock types in the depth interval from about 800 km to 2400 km. Chapter 8of this volume addresses the lowermost mantle including the D" layer at depths in excess of 2400 km.
Читать дальшеИнтервал:
Закладка:
Похожие книги на «Mantle Convection and Surface Expressions»
Представляем Вашему вниманию похожие книги на «Mantle Convection and Surface Expressions» списком для выбора. Мы отобрали схожую по названию и смыслу литературу в надежде предоставить читателям больше вариантов отыскать новые, интересные, ещё непрочитанные произведения.


Обсуждение, отзывы о книге «Mantle Convection and Surface Expressions» и просто собственные мнения читателей. Оставьте ваши комментарии, напишите, что Вы думаете о произведении, его смысле или главных героях. Укажите что конкретно понравилось, а что нет, и почему Вы так считаете.