Mantle Convection and Surface Expressions
Здесь есть возможность читать онлайн «Mantle Convection and Surface Expressions» — ознакомительный отрывок электронной книги совершенно бесплатно, а после прочтения отрывка купить полную версию. В некоторых случаях можно слушать аудио, скачать через торрент в формате fb2 и присутствует краткое содержание. Жанр: unrecognised, на английском языке. Описание произведения, (предисловие) а так же отзывы посетителей доступны на портале библиотеки ЛибКат.
- Название:Mantle Convection and Surface Expressions
- Автор:
- Жанр:
- Год:неизвестен
- ISBN:нет данных
- Рейтинг книги:4 / 5. Голосов: 1
-
Избранное:Добавить в избранное
- Отзывы:
-
Ваша оценка:
Mantle Convection and Surface Expressions: краткое содержание, описание и аннотация
Предлагаем к чтению аннотацию, описание, краткое содержание или предисловие (зависит от того, что написал сам автор книги «Mantle Convection and Surface Expressions»). Если вы не нашли необходимую информацию о книге — напишите в комментариях, мы постараемся отыскать её.
Mantle Convection and Surface Expressions Volume highlights include:
Perspectives from different scientific disciplines with an emphasis on exploring synergies Current state of the mantle, its physical properties, compositional structure, and dynamic evolution Transport of heat and material through the mantle as constrained by geophysical observations, geochemical data and geodynamic model predictions Surface expressions of mantle dynamics and its control on planetary evolution and habitability The American Geophysical Union promotes discovery in Earth and space science for the benefit of humanity. Its publications disseminate scientific knowledge and provide resources for researchers, students, and professionals.
Mantle Convection and Surface Expressions — читать онлайн ознакомительный отрывок
Ниже представлен текст книги, разбитый по страницам. Система сохранения места последней прочитанной страницы, позволяет с удобством читать онлайн бесплатно книгу «Mantle Convection and Surface Expressions», без необходимости каждый раз заново искать на чём Вы остановились. Поставьте закладку, и сможете в любой момент перейти на страницу, на которой закончили чтение.
Интервал:
Закладка:
2.4.3 Post‐Perovskite
Although many studies have focused on slip systems and texture development in MgSiO 3pPv and pPv analogs, the dominant slip systems are still debated. In general, the slip plane tends to be better constrained than slip direction. Nonetheless, three sets of dominant slip systems have been proposed for pPv. These are slip on (010) planes, slip on (100), and/ or {110}〈1  0〉, and finally slip on the (001) plane.
Early studies proposed that slip should occur on the (010) plane based on the fact that this coincides with the layering of the SiO 6octahedra in the pPv structure (Iitaka et al., 2004; Murakami et al., 2004; Oganov & Ono, 2004). Several theoretical calculations have also supported slip on (010) in pPv or pPv analog materials (Carrez et al., 2007b, 2007a; Goryaeva et al., 2015a, 2015b, 2016, 2017; Metsue et al., 2009). Experimental evidence for slip on the (010) plane in pPv is limited to the CaIrO 3analog. Due to the fact that it is stable in the pPv structure at ambient or near‐ambient conditions (Rodi & Babel, 1965), CaIrO 3has been the most studied for deformation mechanisms of the pPv structured compounds. In compression studies, CaIrO 3develops a maximum at (010) in the IPF ( Figure 2.5a; Hunt et al., 2016; Miyagi, Nishiyama, et al., 2008; Niwa et al., 2007). A wide range of experiments using the DAC, D‐DIA, and other large volume apparatus at pressure and temperature condition up to 6 GPa and 1300 K over a range of strain rates all find dominant slip on (010)[100] and (010) ( Table 2.1; Hunt et al., 2016; Miyagi, Nishiyama, et al., 2008; Miyajima et al., 2006; Miyajima & Walte, 2009; Niwa et al., 2007; Walte et al., 2007, 2009; Yamazaki et al., 2006).
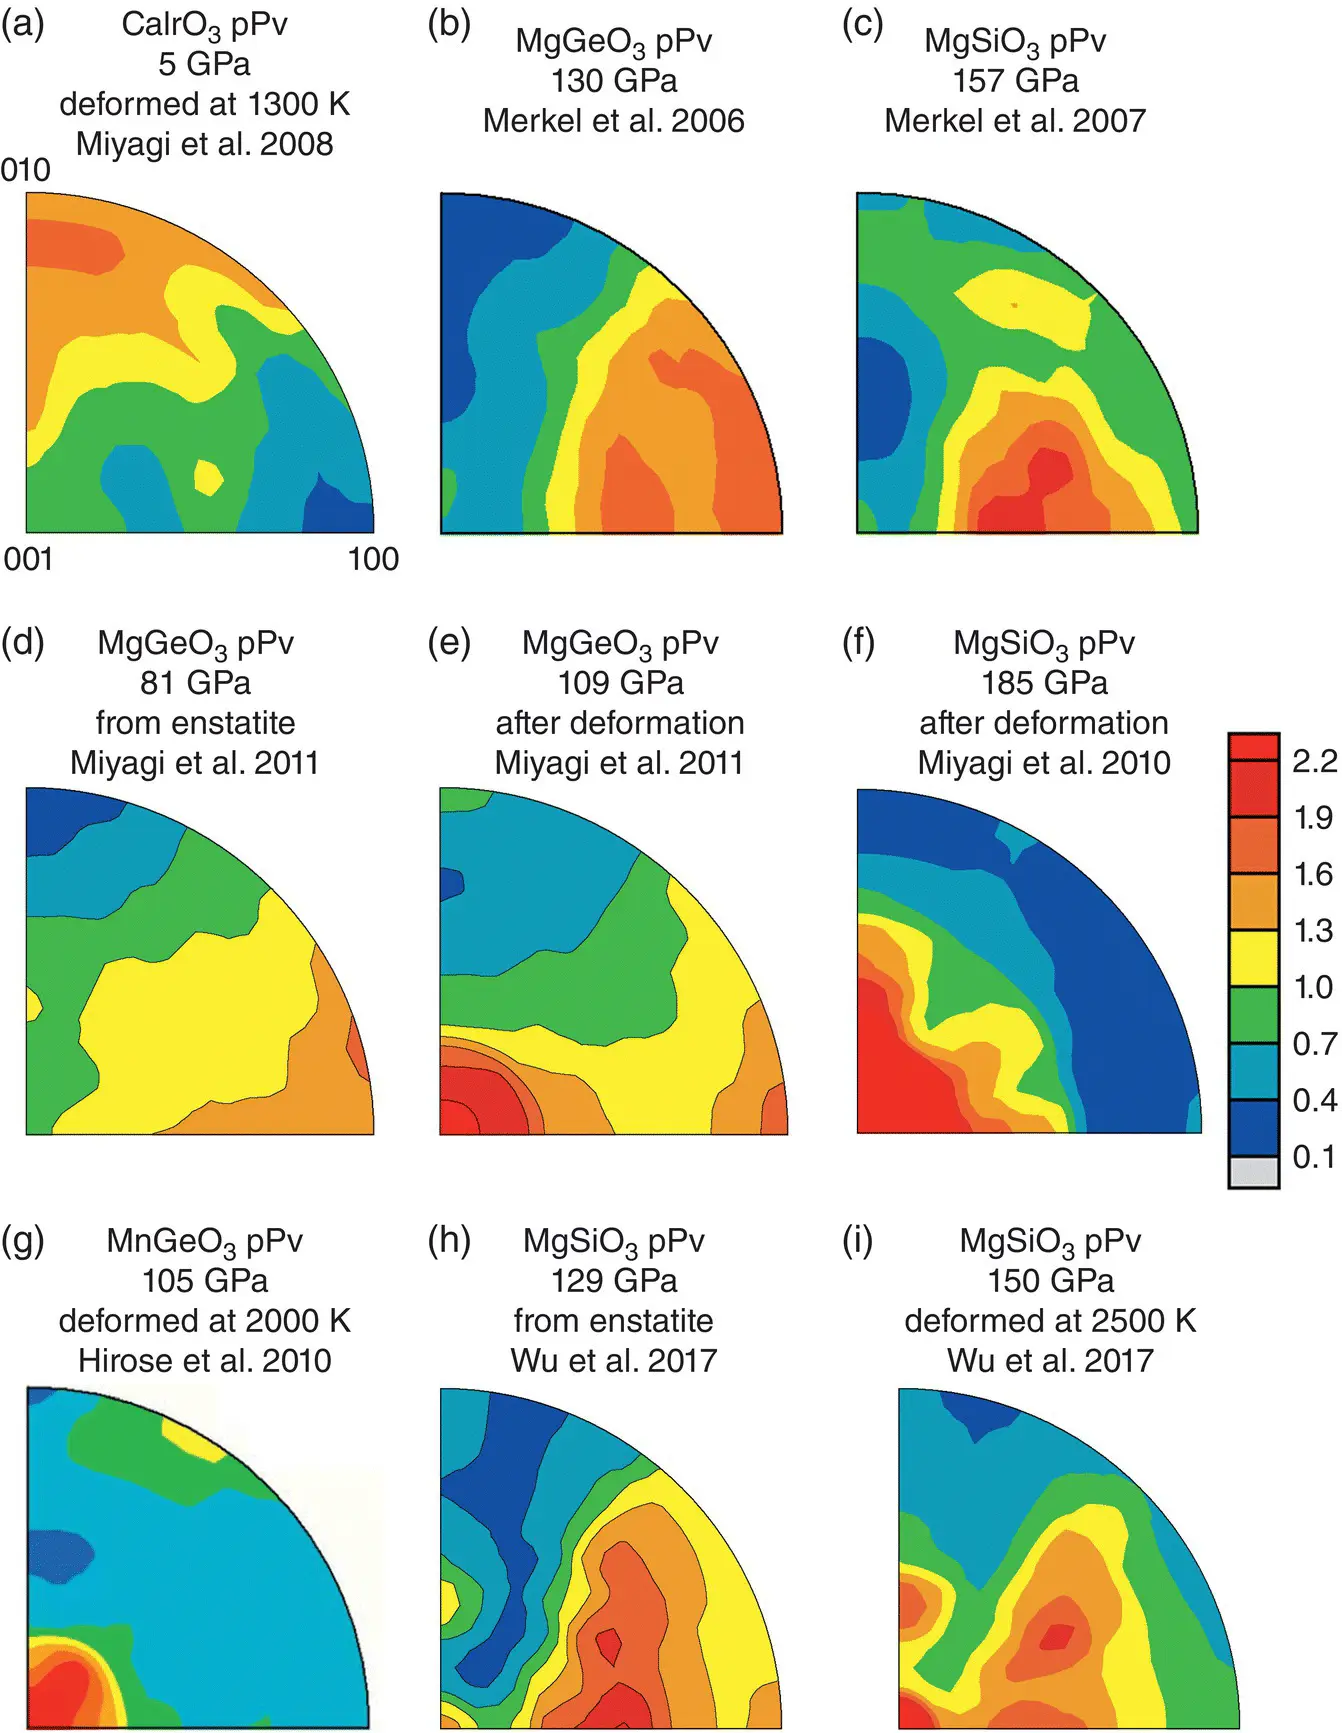
Figure 2.5 Summary of the various textures types observed in post‐perovskite structured compounds over a range of pressure and temperature conditions. Textures are represented as equal area, upper hemisphere projection, inverse pole figures of the compression direction. Scale bar is in multiples of random distribution.
Evidence for (100) or and/ or {110}〈1  0〉 comes from theoretical calculations and two early DAC studies. First‐principles metadynamics and energetics of stacking faults predicted slip on {110}〈1
  0〉 during the phase transformation from Brg to pPv (Oganov et al., 2005). Shortly thereafter, room temperature radial diffraction DAC experiments on MgGeO 3pPv and MgSiO 3pPv found textures characterized by (100) planes at high angles to compression ( Figure 2.5b, c). Polycrystal plasticity modeling showed that these texture could be explained by slip on {110}〈1
  0〉 and (100) planes (Merkel et al., 2006, 2007). It is important to note that both Merkel et al. (2006) and Merkel et al. (2007) converted to the pPv phase directly from the enstatite phase, and no change in texture was observed upon further pressure increase. Subsequent studies on MgGeO 3pPv in the DAC using axial diffraction geometry (Okada et al., 2010) and radial diffraction geometry (Miyagi et al., 2011) found that alignment of (100) planes at high angles to compression resulted from the phase transformation from an enstatite starting material ( Figure 2.5d). Further compression showed that the initial (100) transformation texture shifted to (001) ( Figure 2.5e) upon deformation consistent with dominant slip on (001)[100] (Table 1; Miyagi et al., 2011; Okada et al., 2010).
Slip on (001) planes in the pPv structure is supported by several DAC experiments both at ambient conditions (Miyagi et al., 2010, 2011; Okada et al., 2010) and high temperature (Hirose et al., 2010; Wu et al., 2017). Miyagi et al. (2010) found in pPv synthesized from MgSiO 3glass that an initial (001) texture was observed after conversion at 148 GPa. Upon compression to 185 GPa this texture doubled in strength, consistent with slip on the (001) plane ( Table 2.1; Figure 2.5f). High‐temperature deformation experiments on MnGeO 3pPv documented the development of a (001) texture during compression from 63 GPa to 105 GPa at 2000 K ( Figure 2.5g; Hirose et al., 2010). Deformation textures consistent with (001) slip have also been documented in MgGeO 3pPv ( Figure 2.5e; Miyagi et al., 2011; Okada et al., 2010). More recently, Wu et al. (2017) observed in MgSiO 3pPv a similar transformation texture to that of Merkel et al. (2007) ( Figure 2.5h) followed by the development of a (001) texture during compression to 150 GPa at 2500 K ( Figure 2.5i).
Experimental deformation of MnGeO 3pPv, MgGeO 3pPv, and MgSiO 3pPv are all consistent with slip on (001) ( Table 2.1; Figure 2.5e, f, g, i). There is no clear experimental evidence to support deformation on (100) or {110}〈1  0〉. Textures previously attributed to slip on (100) and {110}〈1
  0〉 have been shown to be due to the transformation from enstatite to pPv ( Figure 2.5d, h). The evidence that slip on (010)[100] is the dominant system in CaIrO 3is clearly robust based on the large number of independent and consistent experimental results (Hunt et al., 2016; Miyajima et al., 2006; Miyajima & Walte, 2009; Niwa et al., 2007; Walte et al., 2007, 2009; Yamazaki et al., 2006). CaIrO 3pPv has very different structural parameters than MgSiO 3pPv, in terms of bond lengths, bond angles, and octahedral distortions (Kubo et al., 2008). Raman spectroscopy measurements have also indicated that bonding in CaIrO 3pPv is different from other pPv structured compounds (Hustoft et al., 2008). First‐principles computations find CaIrO 3pPv to have elastic properties and an electronic structure that are inconsistent with MgSiO 3pPv (Tsuchiya & Tsuchiya, 2007). Finally, first‐principles calculations based on the Peierls‐Nabarro model indicate that MgSiO 3, MgGeO 3, and CaIrO 3exhibit considerable variations in dislocation mobilities (Metsue et al., 2009). Thus, it is perhaps unsurprising that CaIrO 3pPv appears to be a poor analog for the deformation behavior of MgSiO 3pPv. This is unfortunate, as CaIrO 3pPv is the only pPv to be systematically studied at high temperature and varied strain rates.
2.5 POLYPHASE DEFORMATION
Nearly all deformation experiments on lower mantle phases have been performed on single‐phase materials. Some notable exceptions are DAC texture measurements on Brg and Fp mixtures (Miyagi & Wenk, 2016; Wenk et al., 2004; Wenk, Lonardelli, et al., 2006), differential stress measurements on Brg and Fp mixtures using the DAC (Miyagi & Wenk, 2016), and high shear strain steady state deformation using the RDA (Girard et al., 2016).
2.5.1 Stress and Strain Partitioning in Polyphase Aggregates
Several challenges exist for studying deformation of polyphase aggregates. Of primary importance is understanding stress and strain or strain rate partitioning between phases. This can affect both the interpretation of stress levels measured in the individual phases as well as attempts to estimate the bulk mechanical properties of the aggregate. Based on observations of naturally deformed crustal rocks and analogs deformed in laboratory experiments, Handy (1990, 1994) outlined a method to place bounds on the mechanical properties of a two‐phase aggregate with non‐Newtonian rheology and a strength contrast. Others have also outlined methods to study two‐phase deformation either analytically (e.g., Takeda (1998) for Newtonian rheology) or numerically (e.g., Jessell et al., 2009; Takeda & Griera, 2006; Treagus, 2002; Tullis et al., 1991). However Handy’s phenomenological description remains a useful approach to addressing the problem of polyphase deformation. Handy’s description will be briefly summarized below.
Читать дальшеИнтервал:
Закладка:
Похожие книги на «Mantle Convection and Surface Expressions»
Представляем Вашему вниманию похожие книги на «Mantle Convection and Surface Expressions» списком для выбора. Мы отобрали схожую по названию и смыслу литературу в надежде предоставить читателям больше вариантов отыскать новые, интересные, ещё непрочитанные произведения.


Обсуждение, отзывы о книге «Mantle Convection and Surface Expressions» и просто собственные мнения читателей. Оставьте ваши комментарии, напишите, что Вы думаете о произведении, его смысле или главных героях. Укажите что конкретно понравилось, а что нет, и почему Вы так считаете.