Mantle Convection and Surface Expressions
Здесь есть возможность читать онлайн «Mantle Convection and Surface Expressions» — ознакомительный отрывок электронной книги совершенно бесплатно, а после прочтения отрывка купить полную версию. В некоторых случаях можно слушать аудио, скачать через торрент в формате fb2 и присутствует краткое содержание. Жанр: unrecognised, на английском языке. Описание произведения, (предисловие) а так же отзывы посетителей доступны на портале библиотеки ЛибКат.

- Название:Mantle Convection and Surface Expressions
- Автор:
- Жанр:
- Год:неизвестен
- ISBN:нет данных
- Рейтинг книги:4 / 5. Голосов: 1
-
Избранное:Добавить в избранное
- Отзывы:
-
Ваша оценка:
Mantle Convection and Surface Expressions: краткое содержание, описание и аннотация
Предлагаем к чтению аннотацию, описание, краткое содержание или предисловие (зависит от того, что написал сам автор книги «Mantle Convection and Surface Expressions»). Если вы не нашли необходимую информацию о книге — напишите в комментариях, мы постараемся отыскать её.
Mantle Convection and Surface Expressions Volume highlights include:
Perspectives from different scientific disciplines with an emphasis on exploring synergies Current state of the mantle, its physical properties, compositional structure, and dynamic evolution Transport of heat and material through the mantle as constrained by geophysical observations, geochemical data and geodynamic model predictions Surface expressions of mantle dynamics and its control on planetary evolution and habitability The American Geophysical Union promotes discovery in Earth and space science for the benefit of humanity. Its publications disseminate scientific knowledge and provide resources for researchers, students, and professionals.
Mantle Convection and Surface Expressions — читать онлайн ознакомительный отрывок
Ниже представлен текст книги, разбитый по страницам. Система сохранения места последней прочитанной страницы, позволяет с удобством читать онлайн бесплатно книгу «Mantle Convection and Surface Expressions», без необходимости каждый раз заново искать на чём Вы остановились. Поставьте закладку, и сможете в любой момент перейти на страницу, на которой закончили чтение.
Интервал:
Закладка:
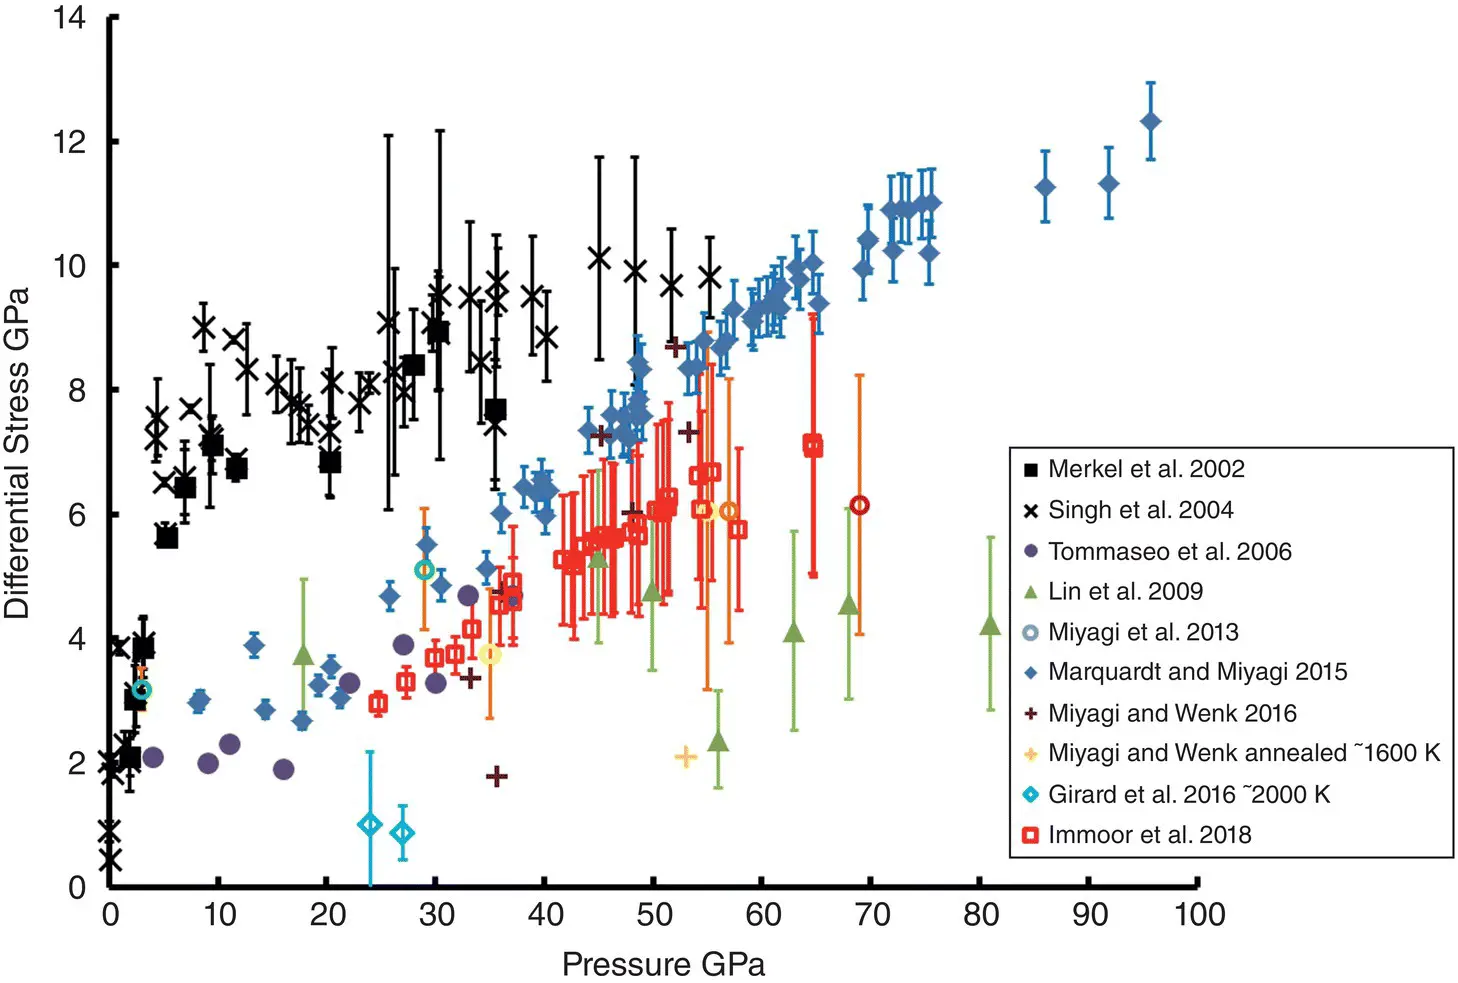
Figure 2.2 Summary of high‐pressure differential stress measurements on periclase and ferropericlase. Measurements in periclase are in black and ferropericlase are in colored symbols.
During higher‐temperature deformation at 1400 K ( Figure 2.2, red open squares), the results of Immoor et al. (2018) show a similar steep trend with pressure, but the magnitude is lower than the room temperature experiments of Marquardt & Miyagi (2015). The results of Immoor et al. (2018) are also generally consistent with the results from Miyagi et al. (2013) ( Figure 2.2, open circles), which used resistive heating and laser + resistive heating to achieve high temperatures in the DAC. Notably, all three of these studies used the same Fp sample. Data points from Miyagi et al. (2013) at ~775 K ( Figure 2.2, yellow open circles) and ~1000 K ( Figure 2.2, orange open circles) using resistive heating are very close to the values of Immoor et al. (2018). The ~2300 K data point using resistive + laser heating ( Figure 2.2, red open circle) is slightly below the data of Immoor et al. (2018), but with overlapping error bars. One should note that the error bars on these data sets represent the range of lattice strains measured on various lattice planes, and large error bars are associated with the large plastic anisotropy of this phase.
The data points of Girard et al. (2016) at ~ 2000 K ( Figure 2.2, blue open diamonds) represent the only large volume experiment at these pressures. Only data collected after ~20 % strain was used for these data points, as this is where steady state stress levels are achieved. These data points lie far below the DAC measurements, and also have a greater separation from the measurements of Marquardt & Miyagi (2015) than the ~2300 K measurement of Miyagi et al. (2013). This difference may be due to lower strain rates in RDA, but may also be due to grain size and the fact that this sample was deformed as part of a two‐phase assemblage. There is additionally another low data point from Miyagi & Wenk (2016) that was annealed at ~1600 K for ~30 minutes ( Figure 2.2, yellow cross). It is unsurprising that this point is low, as this is essentially a stress relaxation experiment.
When comparing DAC experiments to DAC experiments, the results on Per (Merkel et al., 2002; Singh et al., 2004) are quite consistent. Aside from the data of J.‐F. Lin et al. (2009), room‐temperature results of Marquardt & Miyagi (2015), Miyagi et al. (2013) Miyagi & Wenk (2016), and Tommaseo et al. (2006) are all quite similar, particularly when considering compositional variations between these experiments. There is not an obvious trend for strength and composition. However, a low‐pressure deformation study by Long et al. (2006) found that Fp samples with high Fe contents (>50%) develop texture faster than samples with low Fe contents, indicating a weakening with high Fe content. The effects of Fe content, grain size, strain rate, and temperature still need to be systematically explored for Fp at mantle conditions.
CaSiO3 Perovskite.
Flow strength measurements on major mantle silicates are even more limited than measurements on Fp. Two differential stress measurements in the DAC exist for Ca‐Pv. Shieh et al. (2004) used energy dispersive x‐ray diffraction to measure differential stress in Ca‐Pv to ~60 GPa ( Figure 2.3, black open circles). Miyagi et al. (2009) used angle dispersive x‐ray diffraction to measure differential stresses to 49 GPa ( Figure 2.3, black closed circles). There is a large discrepancy between these measurements, with the values of Miyagi et al. (2009) about twice as large as those of Shieh et al. (2004). In addition to potential differences in grain size, there are a couple possibilities for differences in strength measurements. Shieh et al. (2004) used a natural sample (unspecified composition), while Miyagi et al. (2009) used a synthetic starting material; thus, starting material composition could play a role. Perhaps a more likely explanation is the use of laser absorbers in these experiments. In the work of Shieh et al. (2004), Pt was mixed in the sample to use as a laser absorber. In contrast, in the work of Miyagi et al. (2009), amorphous boron was mixed with the sample. It is possible that presence of boron can artificially raise the strength of the sample through doping or pining at grain boundaries. In any case, if the values of Miyagi et al. (2009) are reflective of flow strength, then Ca‐Pv would have the highest room temperature flow strength of the major mantle silicates. However, if the measurements of Shieh et al. (2004) represent the true room temperature flow strength, then Ca‐Pv has a similar room temperature flow strength to Brg.
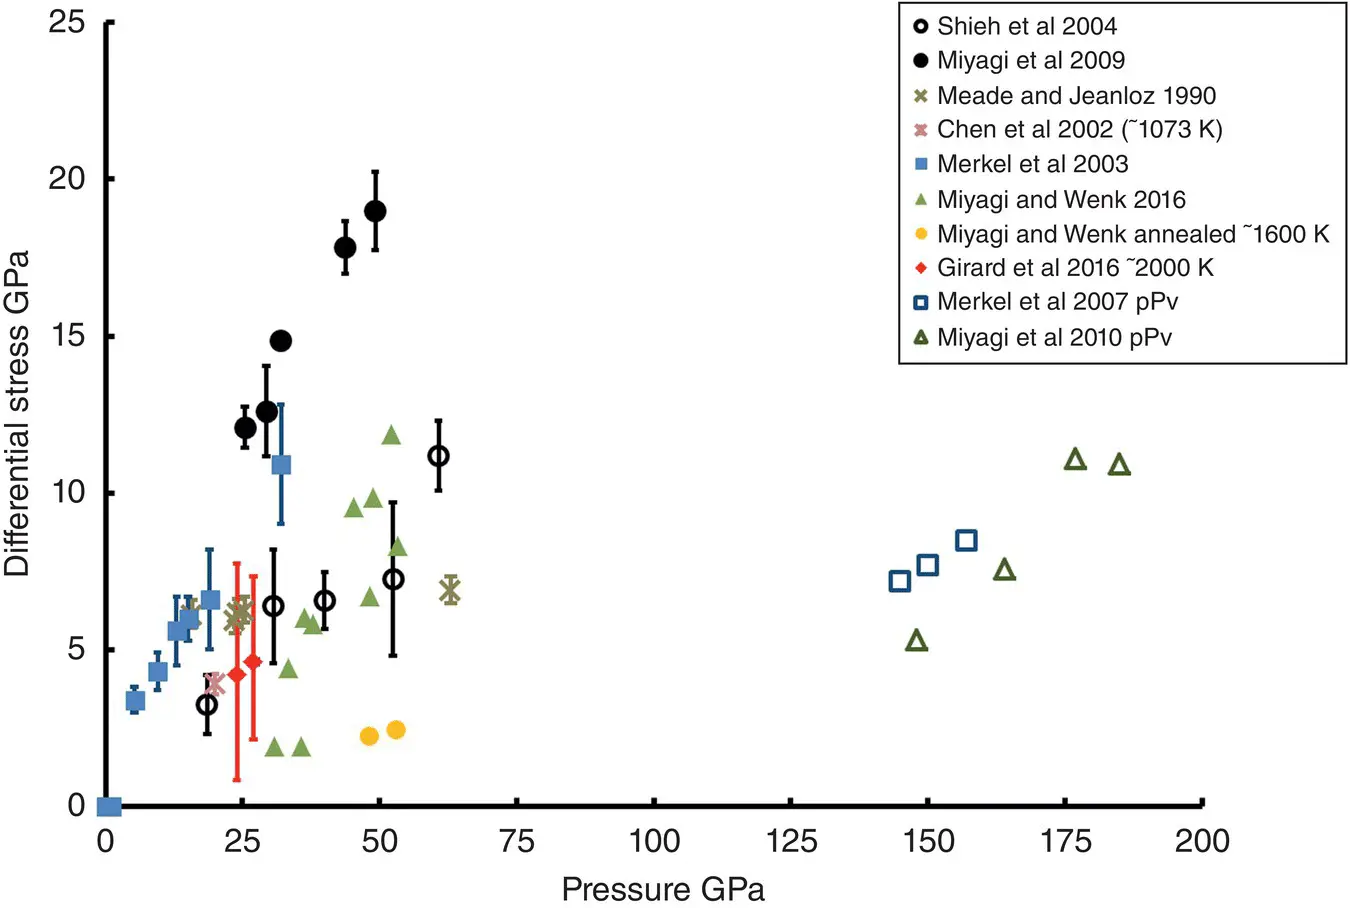
Figure 2.3 Summary of high‐pressure differential stress measurement on CaSiO 3perovskite, bridgmanite and MgSiO 3post‐perovskite. Measurements on CaSiO 3perovskite are shown in black symbols, measurements on bridgmanite are shown in closed colored symbols, and measurements on MgSiO 3post‐perovskite are shown with open colored symbols.
Bridgmanite.
Of the measurements on Brg, one measurement was made in the DAC on a presynthesized sample using ruby fluorescence and the pressure gradient technique (Meade & Jeanloz, 1990). Two measurements have been made in the DAC with angle dispersive diffraction on a presynthesized sample (Merkel et al., 2003) or samples synthesized in‐situ from enstatite, olivine, and ringwoodite (Miyagi & Wenk, 2016). All of these DAC experiments were performed at room temperature, aside from two data points from Miyagi & Wenk (2016) where samples were annealing at ~1600K for 30 minutes. Two studies using large volume apparatus have also been performed. Chen et al. (2002) performed stress relaxation experiments using a DIA type apparatus and determined stress levels from x‐ray line broadening. More recently, Girard et al. (2016) performed high shear strain experiments using the RDA in conjunction with energy dispersive x‐ray diffraction to determine stress levels in a two‐phase aggregate of Brg and Fp. This is to date the only high pressure and high temperature controlled strain rate deformation experiment on Brg. For the differential stresses plotted in Figure 2.3for Girard et al. (2016), only data collected after ~20% strain was used, as this is where steady‐state stress levels are achieved. One should note that in Miyagi & Wenk (2016), a moment pole stress model was used to fit lattice strains, and standard deviations from this model (smaller than the symbols in Figure 2.2) represent errors in fitting and likely underestimates errors in the measurement and those due to plastic anisotropy. Thus, this study has smaller error bars than other measurements.
When looking at differential stress measurements on Brg, the slope of differential stress versus pressure is steep, with the exception of the data of Meade & Jeanloz (1990), which is much flatter ( Figure 2.3, green Xs). Stresses are highest in the experiment of Merkel et al. (2003) ( Figure 2.3, blue squares). This sample, like Meade & Jeanloz (1990), was mostly compressed outside of the Brg stability field (P<~23 GPa), and it is unclear if this may affect the flow strength of the material. The slope of the room temperature data of Miyagi & Wenk (2016) is the steepest but data points at ~30 GPa are immediately after synthesis and prior to deformation ( Figure 2.3, green triangles) so are not reflective of the materials flow strength. If we assume that the highest measured stresses in the DAC are reflective of the room temperature flow strength, then Brg is significantly stronger than Fp, particularly at lower pressures. However Fp becomes much closer in strength to Brg at higher pressures ( Figure 2.2, 3). Differential stresses measured in Brg in the large‐volume apparatus at high temperature are lower than room temperature DAC experiments ( Figure 2.3). Stress levels measured in Chen et al. (2002) ( Figure 2.3, light red X) and Girard et al. (2016) ( Figure 2.3, red diamonds) are 2–3 GPa lower than measurements of Meade & Jeanloz (1990) and Merkel et al. (2003) at similar pressures, though the large error bars of Girard et al. (2016) do overlap with the DAC data. Interestingly, the stress levels measured in the study of Chen et al. (2002) at 1073 K are very similar to those of Girard et al. (2016) at ~2000 K. It is unsurprising that stress relaxation provides a lower value than steady state measurements. Likewise, the DAC annealing points of Miyagi & Wenk (2016) at ~50 GPa are quite low. Recently Kraych et al. (2016) used molecular dynamics simulations to study temperature dependence of the strength of Brg. At 30 GPa, the calculations of Kraych et al. (2016) show reasonably good agreement with both room temperature DAC measurements and the high‐temperature measurements of Girard et al. (2016), showing the great potential for theory to link room‐temperature measurement to high‐temperature measurements and also the potential to link laboratory strain rates to mantle strain rates.
Читать дальшеИнтервал:
Закладка:
Похожие книги на «Mantle Convection and Surface Expressions»
Представляем Вашему вниманию похожие книги на «Mantle Convection and Surface Expressions» списком для выбора. Мы отобрали схожую по названию и смыслу литературу в надежде предоставить читателям больше вариантов отыскать новые, интересные, ещё непрочитанные произведения.


Обсуждение, отзывы о книге «Mantle Convection and Surface Expressions» и просто собственные мнения читателей. Оставьте ваши комментарии, напишите, что Вы думаете о произведении, его смысле или главных героях. Укажите что конкретно понравилось, а что нет, и почему Вы так считаете.