Salivary Gland Pathology
Здесь есть возможность читать онлайн «Salivary Gland Pathology» — ознакомительный отрывок электронной книги совершенно бесплатно, а после прочтения отрывка купить полную версию. В некоторых случаях можно слушать аудио, скачать через торрент в формате fb2 и присутствует краткое содержание. Жанр: unrecognised, на английском языке. Описание произведения, (предисловие) а так же отзывы посетителей доступны на портале библиотеки ЛибКат.
- Название:Salivary Gland Pathology
- Автор:
- Жанр:
- Год:неизвестен
- ISBN:нет данных
- Рейтинг книги:3 / 5. Голосов: 1
-
Избранное:Добавить в избранное
- Отзывы:
-
Ваша оценка:
Salivary Gland Pathology: краткое содержание, описание и аннотация
Предлагаем к чтению аннотацию, описание, краткое содержание или предисловие (зависит от того, что написал сам автор книги «Salivary Gland Pathology»). Если вы не нашли необходимую информацию о книге — напишите в комментариях, мы постараемся отыскать её.
now features case presentations to place the information in context, as well as additional treatment algorithms in each chapter to assist in clinical decision making. Written by highly respected clinicians, educators, and researchers with extensive expertise in oral and maxillofacial surgery, this authoritative resource:
Reviews the etiology, diagnosis, and treatment of all salivary gland pathologies, with detailed explanations and hundreds of full-color clinical images Incorporates new information on the taxonomy of salivary gland tumors, neoplastic and non-neoplastic entities, image guided biopsies of salivary gland lesions, and complications in traditional and non-traditional forms of salivary gland surgery Offers expanded coverage of histopathology, including classification, grading, and staging of salivary gland tumors Features up-to-date chapters on anatomy and physiology, imaging, cysts, systemic diseases, tumors, trauma, and innovative salivary gland surgical techniques Includes a discussion of meta-analyses and systematic reviews to support evidence-based practice remains the definitive resource for oral and maxillofacial surgeons, otolaryngologists, head and neck surgeons, and general surgeons as well as their residents providing care for patients with salivary gland pathology.
Salivary Gland Pathology — читать онлайн ознакомительный отрывок
Ниже представлен текст книги, разбитый по страницам. Система сохранения места последней прочитанной страницы, позволяет с удобством читать онлайн бесплатно книгу «Salivary Gland Pathology», без необходимости каждый раз заново искать на чём Вы остановились. Поставьте закладку, и сможете в любой момент перейти на страницу, на которой закончили чтение.
Интервал:
Закладка:
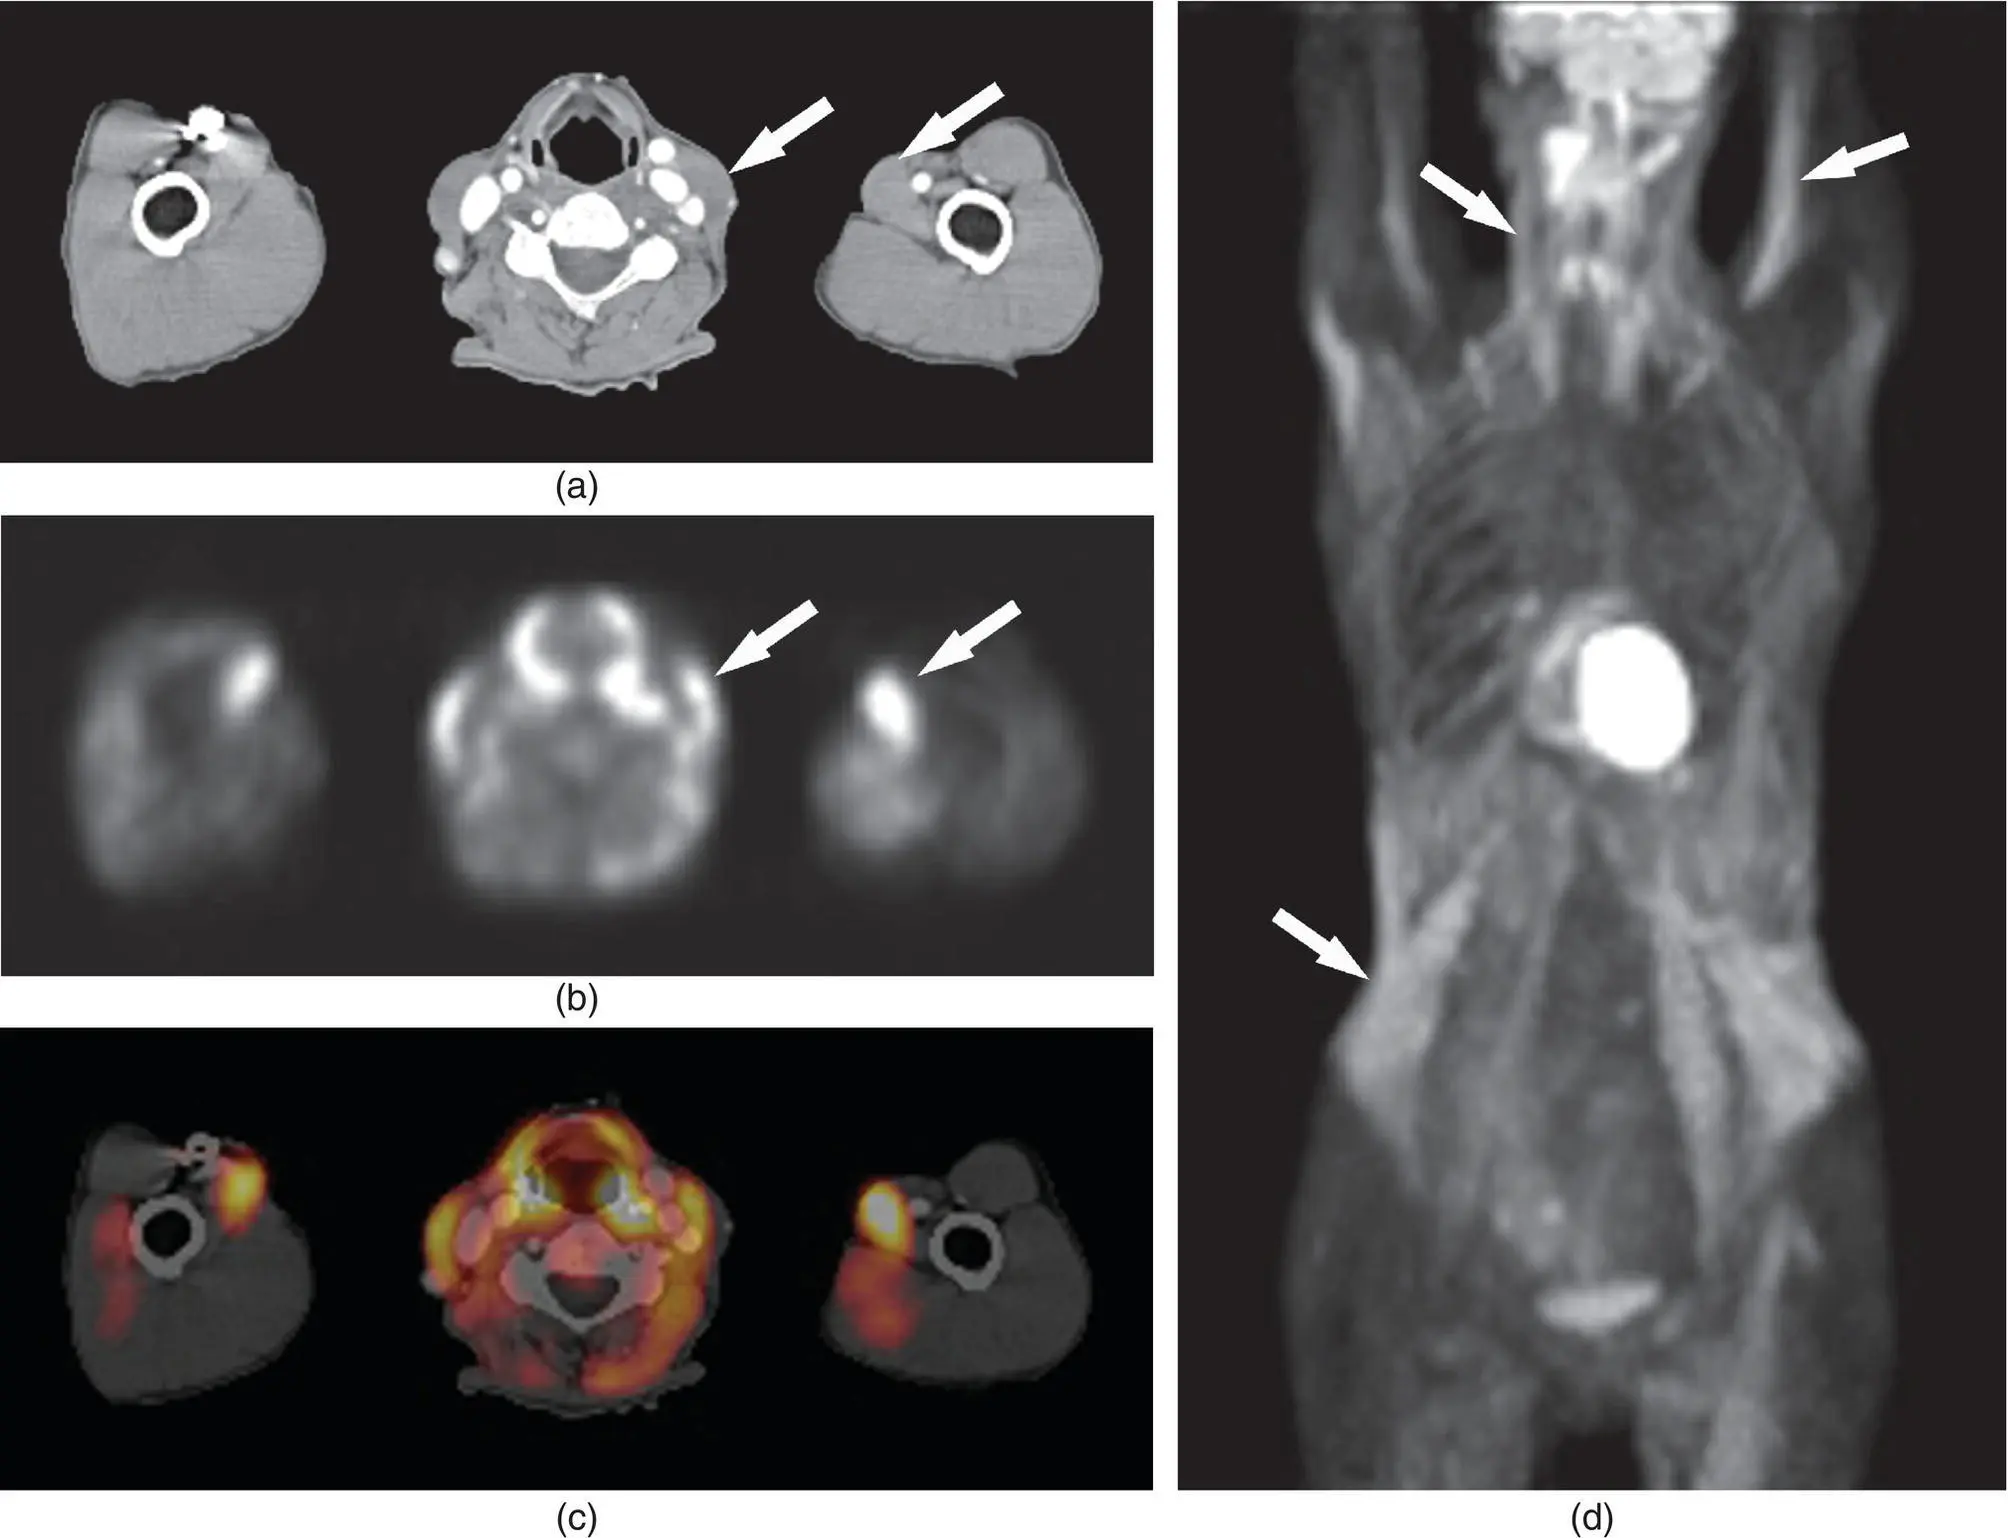
Figure 2.26. CT (a), PET (b), and fused PET/CT (c) images in axial plane and an anterior maximum intensity projection (MIP) image (d) demonstrating skeletal muscle uptake in the sternocleidomastoid muscle and biceps muscle (arrows). Note also the intense uptake in the abdominal, psoas, and intercostal muscles on the MIP image. The very high focal uptake in the middle of the image is myocardial activity.
FDG uptake in all salivary glands in the normal state is usually mild and homogenous (Burrell and Van den Abbeele 2005; Wang et al. 2007) ( Figures 2.28and 2.29). After therapy, radiation or chemotherapy, the uptake can be very high (Burrell and Van den Abbeele 2005). Standardized uptake values (SUVs), a semiquantitative measurement of the degree of uptake of a radiotracer (FDG), may be calculated on PET scans. There are many factors that impact the measurement of SUVs, including the method of attenuation correction and reconstruction, size of lesion, size of region of interest, motion of lesion, recovery coefficient, plasma glucose concentration, body habitus and time from injection to imaging (Beaulier et al. 2003; Schoder et al. 2004; Wang et al. 2007).
A range of SUVs can be calculated in normal volunteers for each salivary gland. Wang et al. measured SUVs in normal tissues to determine the maximum SUV and mean SUV as well as assignment of an uptake grade ranging from none (mean SUV less than aortic blood pool) to mild (mean SUV greater than mean SUV of aortic blood pool but less than 2.5), moderate (mean SUV between 2.5 and 5.0), and intense (mean SUV greater than 5.0). SUV greater than 2.5 was considered significant (Wang et al. 2007). Parotid glands ( n = 97) had a range of SUVmax of 0.78–20.45 and a SUVmean range of 1.75 ± 0.79. Fifty‐three percent of the SUV measurements fell into the “none” category, 33% into the “mild” category, and 14% into the “moderate” category. No SUV measurement fell into the “intense” category. Submandibular glands ( n = 99) had a SUVmax range of 0.56–5.14 and a SUVmean of 2.22 ± 0.77. The uptake grades consisted of the following: 25% were in the “none” category, 44% in the “mild,” and 31% were in the “moderate.” The sublingual gland ( n = 102) had a SUVmax range of 0.93–5.91 and a SUVmean of 4.06 ± 1.76. Four percent of these fell into the “none” category, 19% in the “mild,” 54% in the “moderate,” and 23% in the “intense” group (Wang et al. 2007). Similar work by Nakamoto et al. demonstrated SUVmean of 1.9 ± 0.68 for the parotid gland, 2.11 ± 0.57 for the submandibular gland and 2.93 ± 1.39 for the sublingual gland (Nakamoto et al. 2005). This demonstrates the wide range of normal uptake values ( Table 2.3).
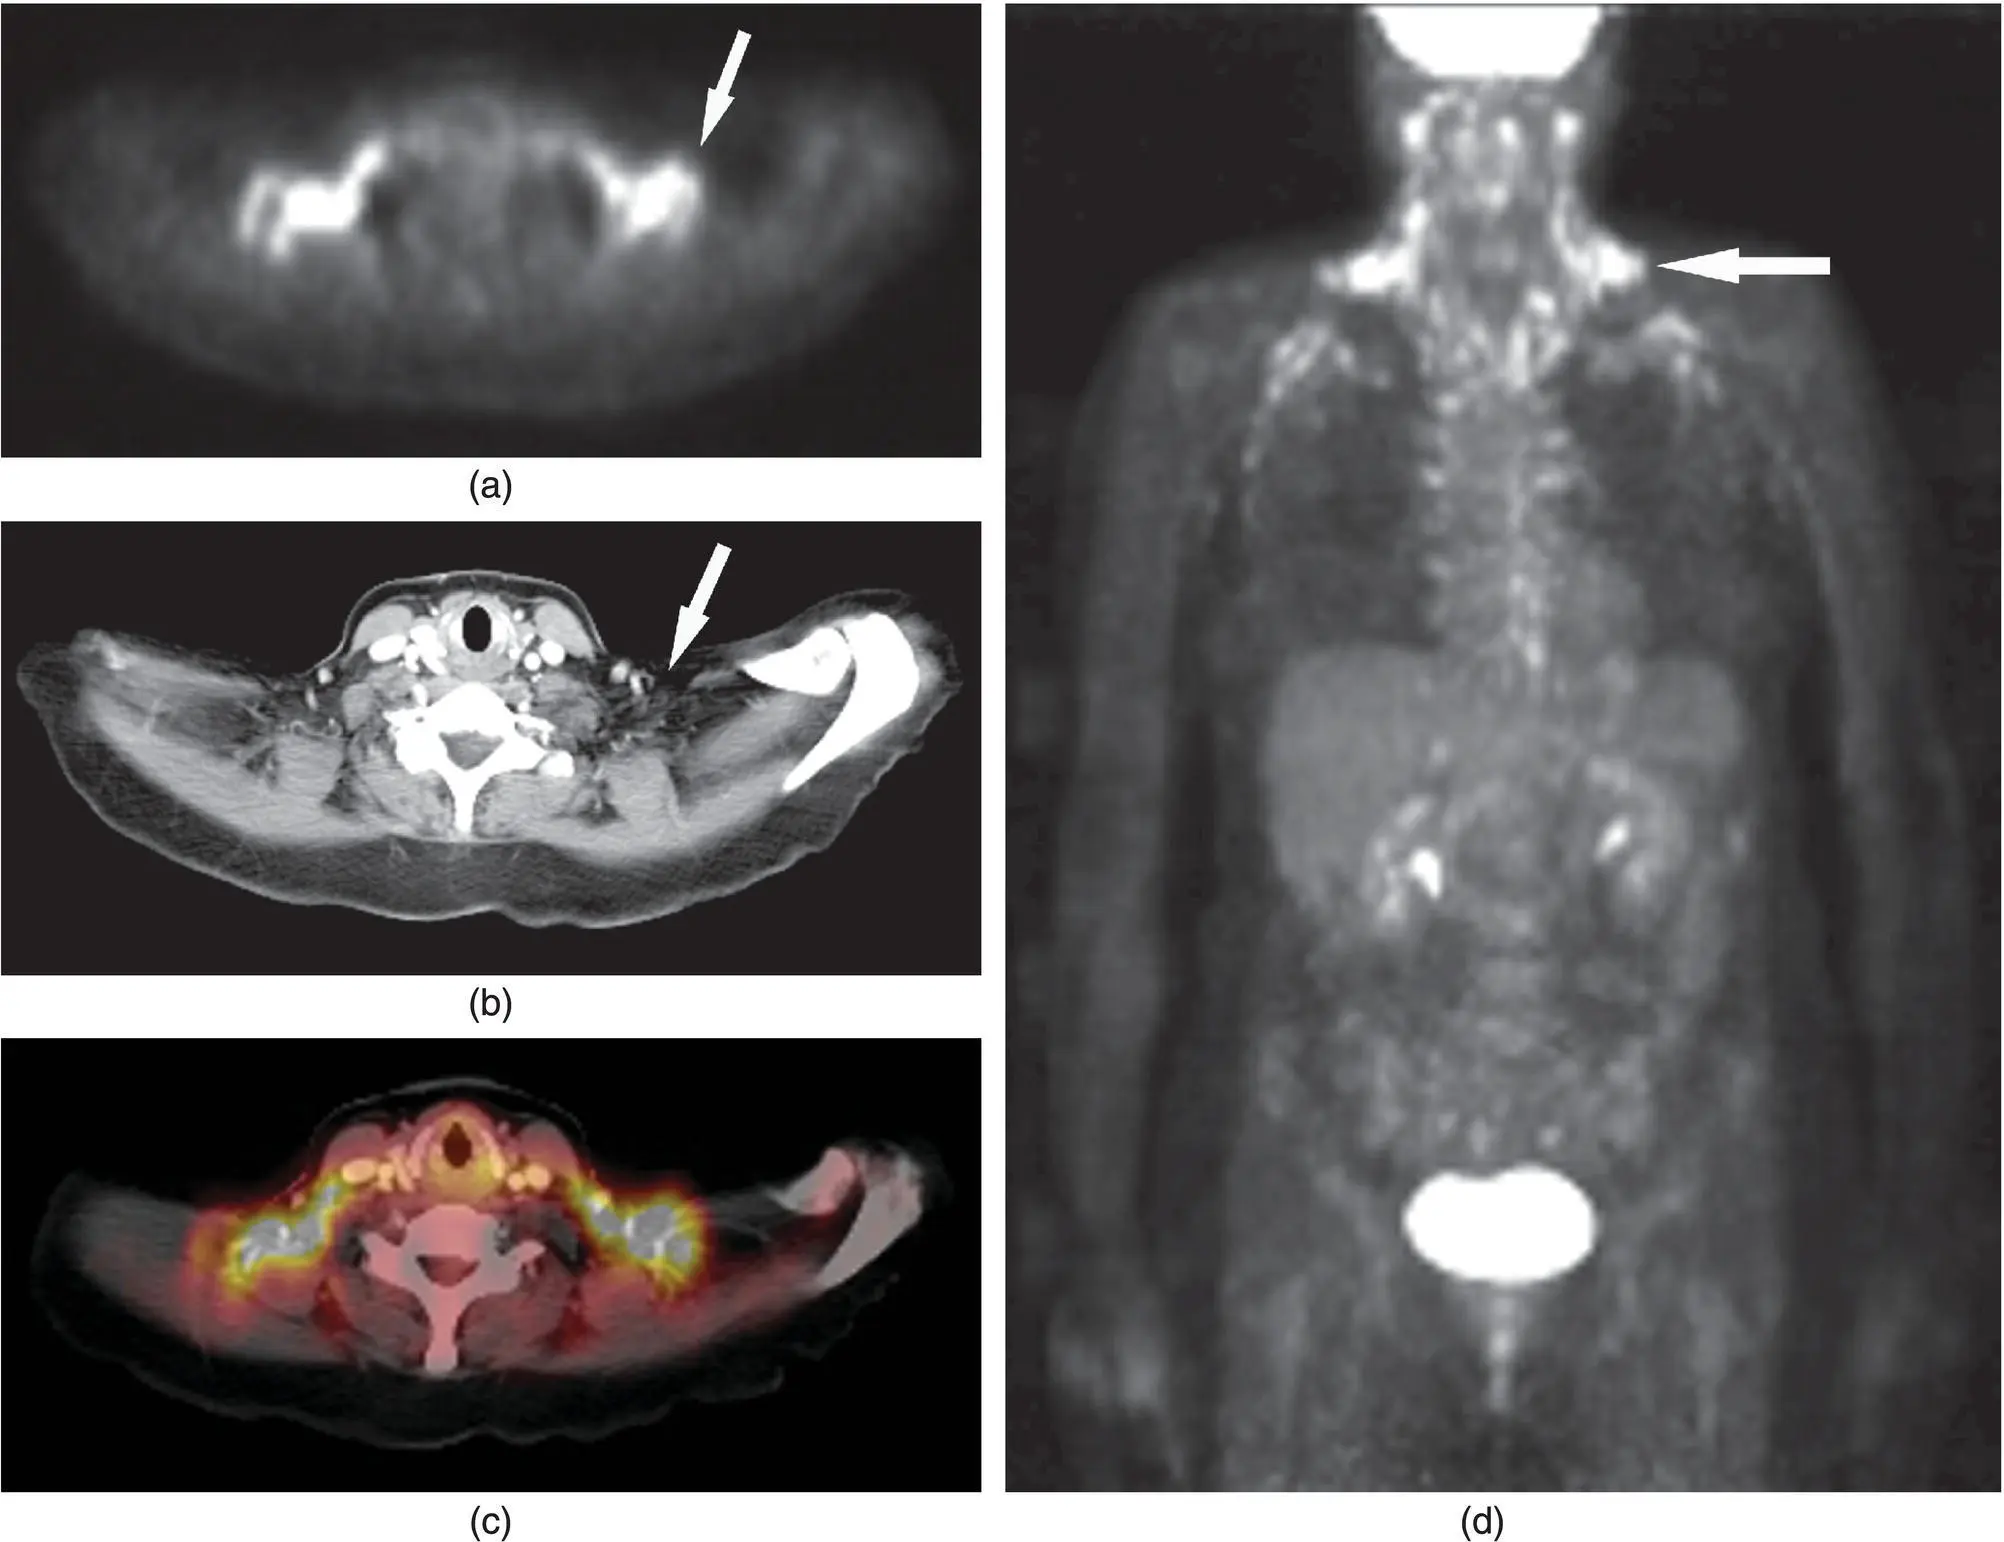
Figure 2.27. PET image (a), corresponding CT image (b) and a fused PET/CT image (c) in the axial plane demonstrating brown adipose tissue (BAT) uptake in the supraclavicular regions bilaterally, which could mimic lymphadenopathy (see arrows on a and b). Direct correlation enabled by the PET/CT prevents a false positive finding. Note the similar uptake on the MIP image (arrow) (d) including paraspinal BAT uptake.
Although, FDG does accumulate in the saliva, the concentration varies from 0.2–0.4 SUV but does not influence FDG imaging (Stahl et al. 2002). SUV of greater than 2.5 has become a threshold for abnormal or neoplastic uptake (originally described by Patz et al.) (Patz et al. 1993; Wang et al. 2007). However, careful analysis must be undertaken when evaluating lesions based on SUVs as there is a significant overlap of SUVs for malignant and benign tumors and inflammatory conditions. One cannot depend on SUV measurements alone, and must take into consideration clinical data as well as radiologic imaging findings.
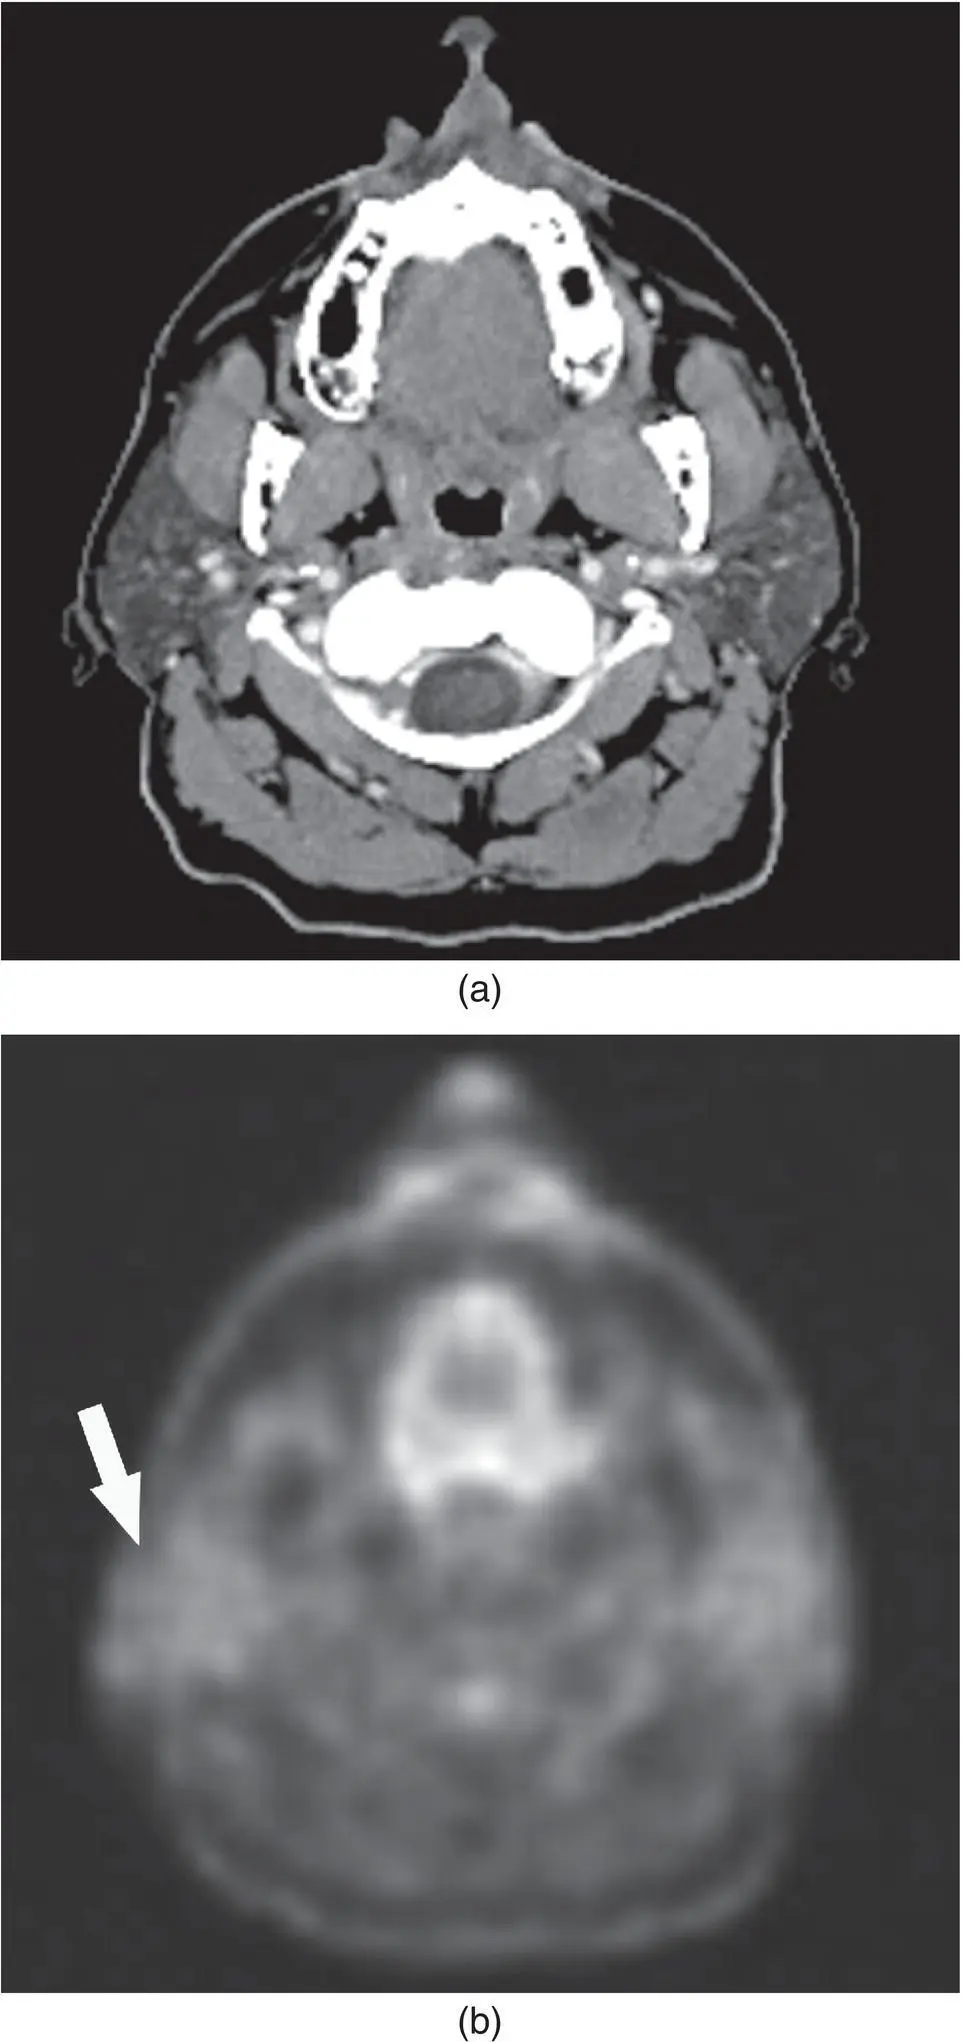
Figure 2.28. CT (a) and PET (b) images in axial plane demonstrating normal parotid gland activity (arrow).
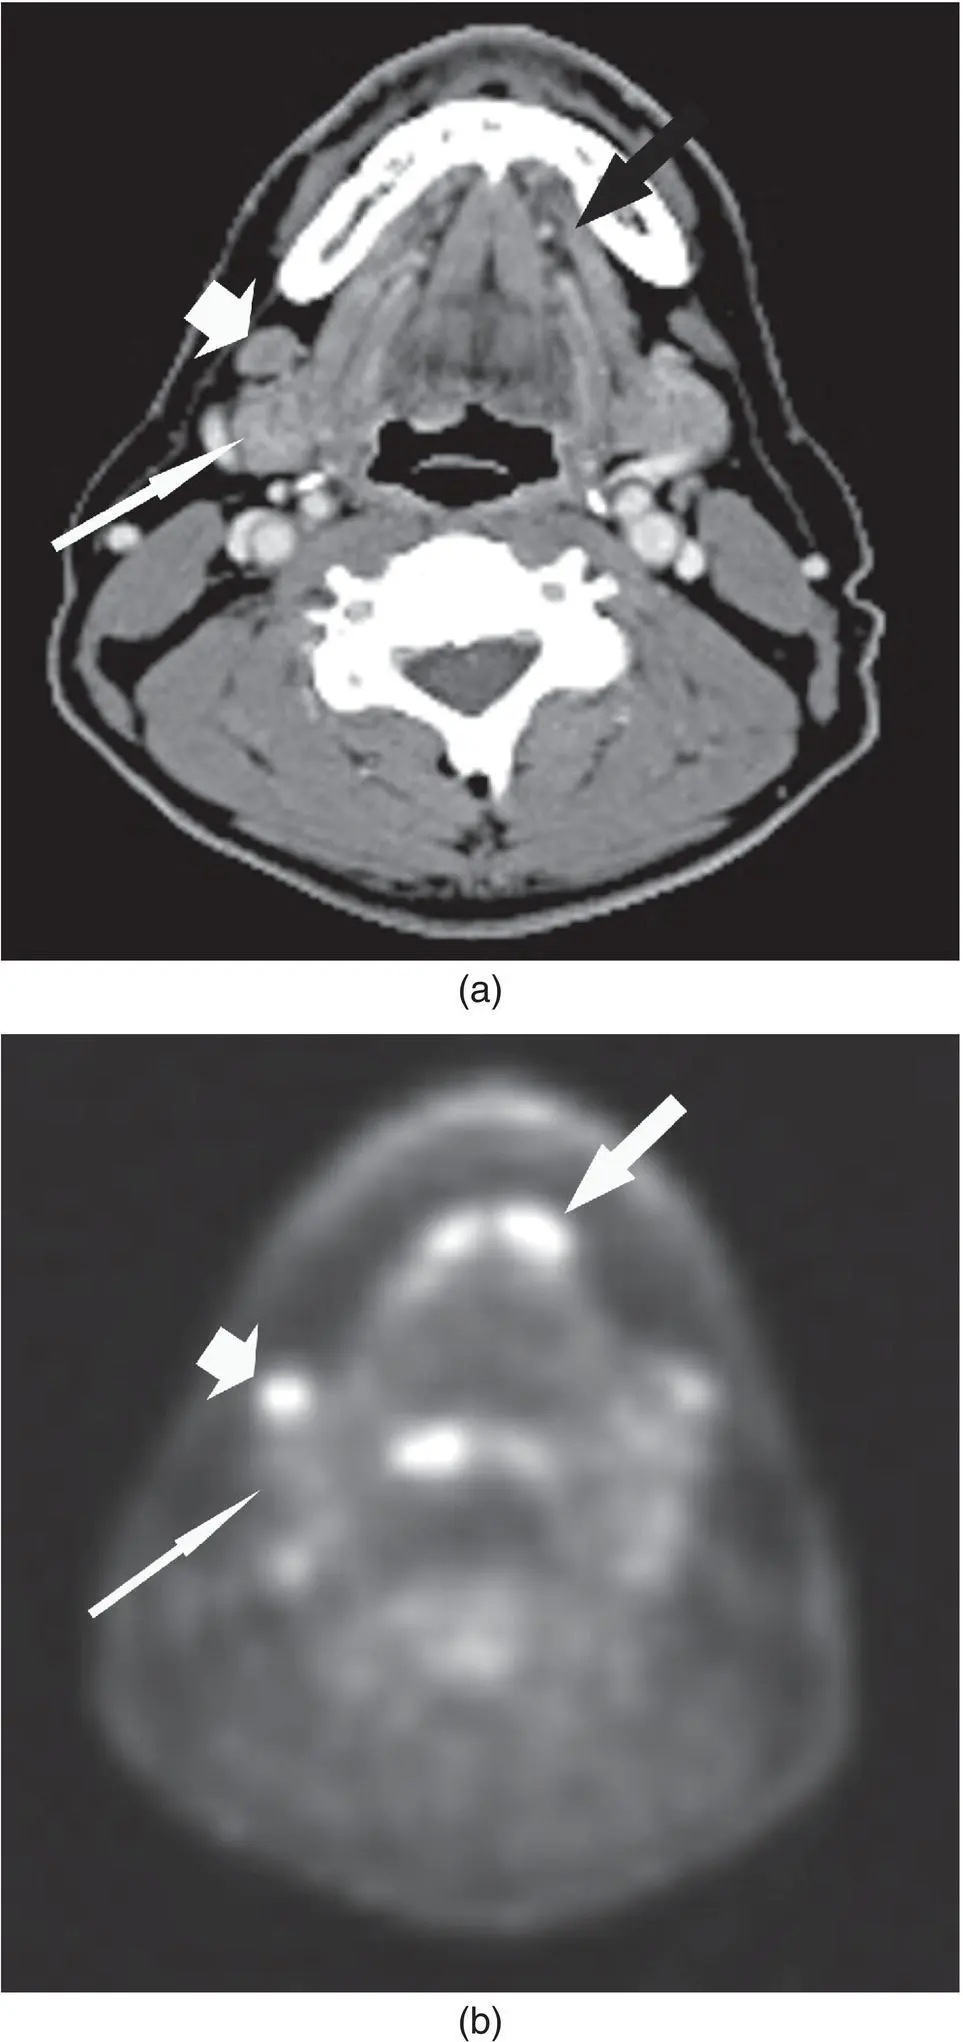
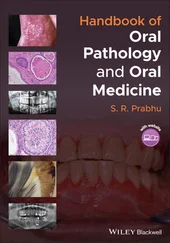
Figure 2.29. CT (a) and PET (b) images in axial plane demonstrating normal submandibular (long thin arrow) and sublingual gland (medium arrow) activity. Note the abnormal uptake higher than and anterior to the submandibular glands (short fat arrow). Metastatic lymphadenopathy was diagnosed at the time of surgery.
Table 2.3. Standard uptake value (SUV) of salivary glands.
Source: Data from Wang et al. (2007) and Nakamoto et al. (2005).
| Gland | SUV max (range) a | SUV mean ± SD a | SUV mean ± SD b |
|---|---|---|---|
| Parotid gland | 0.78–20.45 | 1.75 ± 0.79 | 1.90 ± 0.68 |
| Submandibular gland | 0.56–5.14 | 2.22 ± 0.77 | 2.11 ± 0.57 |
| Sublingual gland | 0.93–5.91 | 4.06 ± 1.76 | 2.93 ± 1.39 |
a Wang (2007).
b Nakamoto (2005).
SD = standard deviation.
POSITRON EMISSION TOMOGRAPHY/COMPUTED TOMOGRAPHY (PET/CT)
Head and neck imaging has greatly benefited from the use FDG PET imaging for the staging, restaging, and follow‐up of neoplasms. The recent introduction of PET/CT has dramatically changed the imaging of diseases of the head and neck by directly combining anatomic and functional imaging.
The evaluation of the head and neck with FDG PET/CT has been significantly and positively affected with detection and demonstration of the extent of primary disease, lymphadenopathy, and scar versus recurrent or residual disease, pre‐surgical staging, pre‐radiosurgery planning and follow‐up post‐therapy.
The role of FDG PET or PET/CT and that of conventional CT and MRI on the diagnosis, staging, restaging, and follow‐up post‐therapy of salivary gland tumors has been studied (Keyes et al. 1994; Bui et al. 2003; Otsuka et al. 2005; Alexander de Ru et al. 2007; Roh et al. 2007). Although both CT and MRI are relatively equal in anatomic localization of disease and the effect of the tumors on local invasion and cervical nodal metastases, FDG PET/CT significantly improved sensitivity and specificity for salivary malignancies including nodal metastases (Otsuka et al. 2005; Uchida et al. 2005; Alexander de Ru et al. 2007; Jeong et al. 2007; Roh et al. 2007).
Early studies have demonstrated FDG PET's relative inability to distinguish benign from malignant salivary neoplasms (Keyes et al. 1994). The variable uptake of FDG by pleomorphic adenomas and the increased uptake and SUVs by Warthin tumors result in significant false positives (Jeong et al. 2007; Roh et al. 2007). In a similar manner, adenoid cystic carcinomas, which are relatively slower growing, may not accumulate significant concentrations of FDG and demonstrate low SUVs and therefore contribute to the false negatives (Jeong et al. 2007; Keyes et al. 1994). False negatives may also be caused by the relatively lower mean SUV of salivary tumors (SUV 3.8 ± 2.1) relative to squamous cell carcinoma (SUV 7.5 ± 3.4) (Roh et al. 2007). The low SUV of salivary neoplasms may also be obscured by the normal uptake of FDG by salivary glands (Roh et al. 2007). In general, FDG PET has demonstrated that lower grade malignancies tend to have lower SUV and vice versa for higher grade malignancies (Jeong et al. 2007; Roh et al. 2007). FDG PET has been shown to be more sensitive and specific compared to conventional CT or MRI (Otsuka et al. 2005; Cermik et al. 2007; Roh et al. 2007). Small tumor size can contribute to false negative results and inflammatory changes contribute to false positive results (Roh et al. 2007). The use of concurrent salivary scintigraphy with 99mTc‐pertechnetate imaging can improve the false positive rate by identifying Warthin's tumors and oncocytomas, which tend to accumulate pertechnetate (and retain it after induced salivary gland washout) and have increased uptake of FDG (Uchida et al. 2005).
Читать дальшеИнтервал:
Закладка:
Похожие книги на «Salivary Gland Pathology»
Представляем Вашему вниманию похожие книги на «Salivary Gland Pathology» списком для выбора. Мы отобрали схожую по названию и смыслу литературу в надежде предоставить читателям больше вариантов отыскать новые, интересные, ещё непрочитанные произведения.


Обсуждение, отзывы о книге «Salivary Gland Pathology» и просто собственные мнения читателей. Оставьте ваши комментарии, напишите, что Вы думаете о произведении, его смысле или главных героях. Укажите что конкретно понравилось, а что нет, и почему Вы так считаете.