Saeid Sanei - EEG Signal Processing and Machine Learning
Здесь есть возможность читать онлайн «Saeid Sanei - EEG Signal Processing and Machine Learning» — ознакомительный отрывок электронной книги совершенно бесплатно, а после прочтения отрывка купить полную версию. В некоторых случаях можно слушать аудио, скачать через торрент в формате fb2 и присутствует краткое содержание. Жанр: unrecognised, на английском языке. Описание произведения, (предисловие) а так же отзывы посетителей доступны на портале библиотеки ЛибКат.
- Название:EEG Signal Processing and Machine Learning
- Автор:
- Жанр:
- Год:неизвестен
- ISBN:нет данных
- Рейтинг книги:3 / 5. Голосов: 1
-
Избранное:Добавить в избранное
- Отзывы:
-
Ваша оценка:
EEG Signal Processing and Machine Learning: краткое содержание, описание и аннотация
Предлагаем к чтению аннотацию, описание, краткое содержание или предисловие (зависит от того, что написал сам автор книги «EEG Signal Processing and Machine Learning»). Если вы не нашли необходимую информацию о книге — напишите в комментариях, мы постараемся отыскать её.
EEG Signal Processing and Machine Learning — читать онлайн ознакомительный отрывок
Ниже представлен текст книги, разбитый по страницам. Система сохранения места последней прочитанной страницы, позволяет с удобством читать онлайн бесплатно книгу «EEG Signal Processing and Machine Learning», без необходимости каждый раз заново искать на чём Вы остановились. Поставьте закладку, и сможете в любой момент перейти на страницу, на которой закончили чтение.
Интервал:
Закладка:
Figure 3.9shows the LEM model. This model uses the formulation by Wilson and Cowan [18] who provided a set of equations to describe the overall activity (not specifically the EGG) in a cartel of excitatory and inhibitory neurons having a large number of interconnections [19]. Similarly, in the LEM the EEG it is assumed that the rhythms are generated by distinct neuronal populations, which possess frequency selective properties. These populations are formed by the interconnection of the individual neurons and are assumed to be driven by a random input. The model characteristics, such as the neural interconnectivity, synapse pulse response, and threshold of excitation are presented by the LEM parameters. The changes in these parameters produce the relevant EEG rhythms.
The input p ( t ) is assumed to result from the summation of a randomly distributed series of random potentials which drive the excitatory cells of the circuit, producing the ongoing background EEG signal. Such signals originate from other deeper brain sources within the thalamus and brain stem and constitute part of the ongoing or spontaneous firing of the central nerve system (CNS). In the model, the average number of inputs to an inhibitory neuron from the excitatory neurons is designated by C eand the corresponding average number from inhibitory neurons to each individual excitatory neuron is C i. The difference of two decaying exponentials are used for modelling each post‐synaptic potential h eor h i:
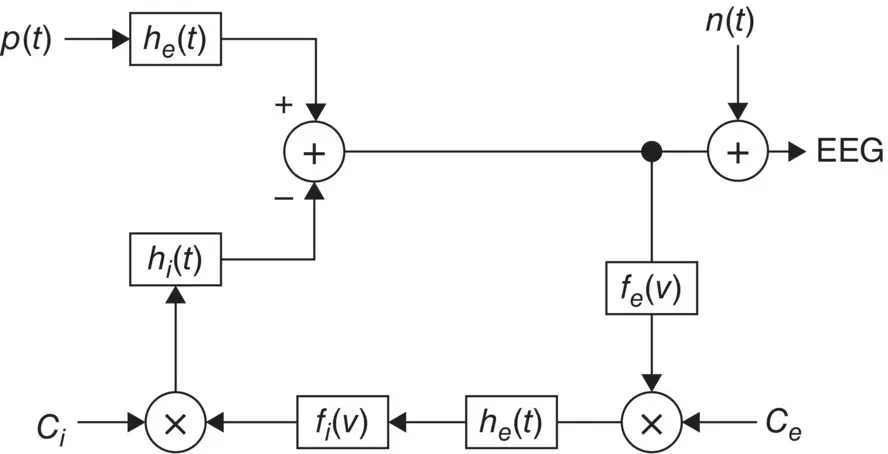
Figure 3.9 The local EEG model (LEM). The thalamocortical relay neurons are represented by two linear systems having impulse responses h e( t ), on the upper branch, and the inhibitory post‐synaptic potential by h i( t ). The nonlinearity of this system is denoted by f e( v ) representing the spike generating process. The interneuron activity is represented by another linear filter h e( t ) in the lower branch, which generally can be different from the first linear system, and a nonlinearity function f i( v ). C eand C irepresent respectively, the number of interneuron cells and the thalamocortical neurons.
(3.35) 
(3.36) 
where A, B , a k, and b kare constant parameters, which control the shape of the pulse waveforms. The membrane potentials are related to the axonal pulse densities via the static threshold functions f eand f i. These functions are generally nonlinear; however, to ease the manipulations they are considered linear for each short time interval. Using this model, the normal brain rhythms such as alpha wave is considered as filtered noise.
A more simplified model is the one presented by Jansen and Rit [20]. This model is shown in Figure 3.10. The model is a neurophysiologically inspired model simulating electrical brain activity (including EEG or evoked potentials (EPs)). A previously developed lumped‐parameter model [16] of a single cortical column has been implemented in their work. The model could produce a large variety of EEG‐like waveforms and rhythms. Coupling two models, with delays in the interconnections to simulate the synaptic connections within and between cortical areas, made it possible to replicate the spatial distribution of alpha and beta activity.
EPs were simulated by presenting pulses to the input of the coupled models. In general, the responses were more realistic than those produced using a single model. The proposed model is based on a nonlinear model of a cortical column described by Jansen and Rit [20] and also based upon Lopes da Silva's lumped‐parameter model [16, 18]. The cortical column is modelled by a population of ‘feed forward’ pyramidal cells, receiving inhibitory and excitatory feedback from local interneurons (i.e. other pyramidal, stellate or basket cells residing in the same column) and excitatory input from neighbouring or more distant columns. The input can be a pulse, arbitrary function, or noise.
Each of the neuron populations is modelled by two blocks. The first block transforms the average pulse density of APs coming to the population of neurons into an average post‐synaptic membrane potential which can either be excitatory or inhibitory. This block is referred to as the post‐synaptic potential (PSP) block and represents a linear transformation with an impulse response given by [20]:
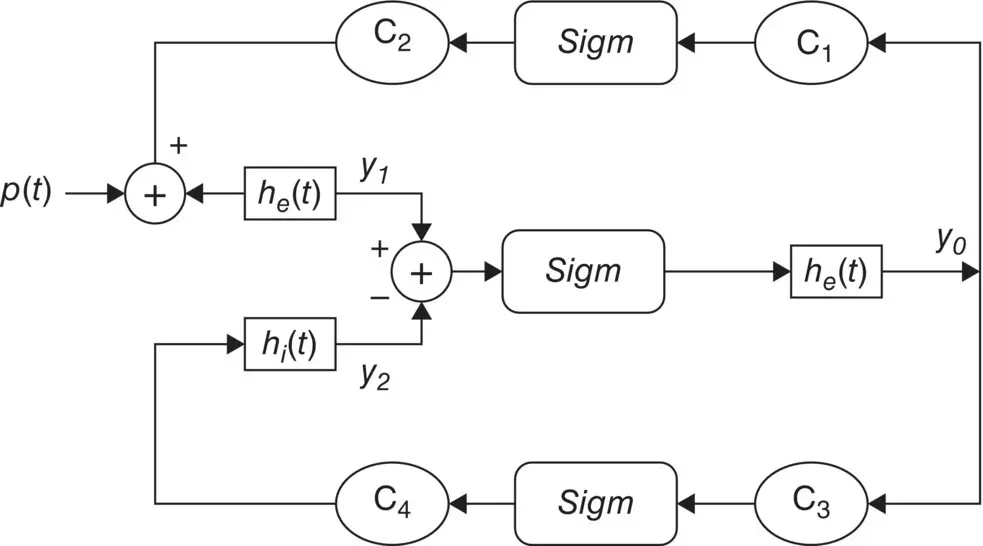
Figure 3.10 Simplified model for brain cortical alpha generation. The input is a pulse‐shaped waveform.
(3.37) 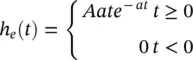
for the excitatory case, and the following for the inhibitory case:
(3.38) 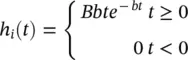
A and B determine the maximum amplitudes of the excitatory and inhibitory PSPs respectively, and a and b are the lumped representation of the sum of reciprocal of the time constant of passive membrane and all other spatially distributed delays in the neuron dendric network. The Sigm function is defined as [21]:
(3.39) 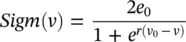
where e 0indicates the maximum firing rate of the neural population, v 0the PSP for which a 50% firing rate is achieved, and r the steepness of sigmoidal transformation. The connectivity constants C 1– C 4in the figure characterize the interaction between the pyramidal cells and the excitatory and inhibitory interneurons which account for the total number of synapses established between the neurons.
As an empirical value, considering C = C 1= 135, typical values suggested for the rest of the parameters are C 2= 0.8C, C 3= 0.25C, C 4= 0.25C, A = 3.25, B = 22, v 0= 6, a = 100 s −1, b = 50 s −1and a d= 30.
The above system has been extended to modelling the visual evoked potentials (VEPs) based on the fact that VEPs are the results of interaction of two or more of so‐called cortical columns. A proposed two‐column model for VEP can be seen in Figure 3.11where each block represents the model in Figure 3.10.
The main problem with such a model is due to the fact that only a single channel EEG is generated and unlike the phase‐coupling model explained in subsection 3.2.2, there is no modelling of interchannel relationships and the inherent connectivity of the brain zones. Therefore, a more accurate model has to be defined to enable simulation of a multichannel EEG generation system. This is still an open question and remains an area of research.
Читать дальшеИнтервал:
Закладка:
Похожие книги на «EEG Signal Processing and Machine Learning»
Представляем Вашему вниманию похожие книги на «EEG Signal Processing and Machine Learning» списком для выбора. Мы отобрали схожую по названию и смыслу литературу в надежде предоставить читателям больше вариантов отыскать новые, интересные, ещё непрочитанные произведения.


Обсуждение, отзывы о книге «EEG Signal Processing and Machine Learning» и просто собственные мнения читателей. Оставьте ваши комментарии, напишите, что Вы думаете о произведении, его смысле или главных героях. Укажите что конкретно понравилось, а что нет, и почему Вы так считаете.