Iam-Choon Khoo - Liquid Crystals
Здесь есть возможность читать онлайн «Iam-Choon Khoo - Liquid Crystals» — ознакомительный отрывок электронной книги совершенно бесплатно, а после прочтения отрывка купить полную версию. В некоторых случаях можно слушать аудио, скачать через торрент в формате fb2 и присутствует краткое содержание. Жанр: unrecognised, на английском языке. Описание произведения, (предисловие) а так же отзывы посетителей доступны на портале библиотеки ЛибКат.
- Название:Liquid Crystals
- Автор:
- Жанр:
- Год:неизвестен
- ISBN:нет данных
- Рейтинг книги:4 / 5. Голосов: 1
-
Избранное:Добавить в избранное
- Отзывы:
-
Ваша оценка:
Liquid Crystals: краткое содержание, описание и аннотация
Предлагаем к чтению аннотацию, описание, краткое содержание или предисловие (зависит от того, что написал сам автор книги «Liquid Crystals»). Если вы не нашли необходимую информацию о книге — напишите в комментариях, мы постараемся отыскать её.
Liquid Crystals,
Liquid Crystals
Liquid Crystals
Liquid Crystals — читать онлайн ознакомительный отрывок
Ниже представлен текст книги, разбитый по страницам. Система сохранения места последней прочитанной страницы, позволяет с удобством читать онлайн бесплатно книгу «Liquid Crystals», без необходимости каждый раз заново искать на чём Вы остановились. Поставьте закладку, и сможете в любой момент перейти на страницу, на которой закончили чтение.
Интервал:
Закладка:
(2.11) 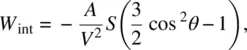
where V is the molar volume ( V = M / p ), S is the order parameter, and A is a constant determined by the transition moments of the molecules. Both V and S are functions of temperature. Comparing Eqs. (2.11)and (2.1)for the definition of S , we note that W int≈ S 2, so this mean‐field theory by Maier and Saupe is often referred to as the S 2interaction theory [1]. This interaction energy is included in the free enthalpy per molecule (chemical potential) and is used in conjunction with an angular distribution function f ( θ , ϕ ) for statistical mechanics calculations.
2.3.1. Maier–Saupe Theory: Order Parameter Near T c
Following the formalism of deGennes, the interaction energy may be written as
(2.12) 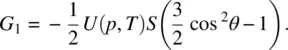
The total free enthalpy per molecule is therefore
(2.13) 
where G iis the free enthalpy of the isotropic phase. Minimizing G ( p , T ) with respect to the distribution function f , one gets
(2.14) 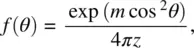
where
(2.15) 
and the partition function z is given by
(2.16) 
From the definition of  , we have
(2.17) 
The coupled Eqs. (2.15)and (2.17)for m and S may be solved graphically for various values of U/K B T , the relative magnitude of the intermolecular interaction to the thermal energies. Figure 2.2depicts the case for T below a temperature T cdefined by
(2.18) 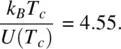
Figure 2.2shows that curves 1 and 2 for S intersect at the origin O and two points N and M . Both points O and N correspond to minima of G , whereas M corresponds to a local maximum of G . For T < T c, the value of G is lower at point N than at point O ; that is, S is nonzero and corresponds to the nematic phase. For temperatures above T cthe stable (minimum energy) state corresponds to O ; that is, S = O and corresponds to the isotropic phase.
The transition at T = T cis a first‐order one. The order parameter just below T cis
(2.19) 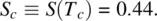
It has also been demonstrated that the temperature dependence of the order parameter of most nematics is well approximated by the expression [9]:
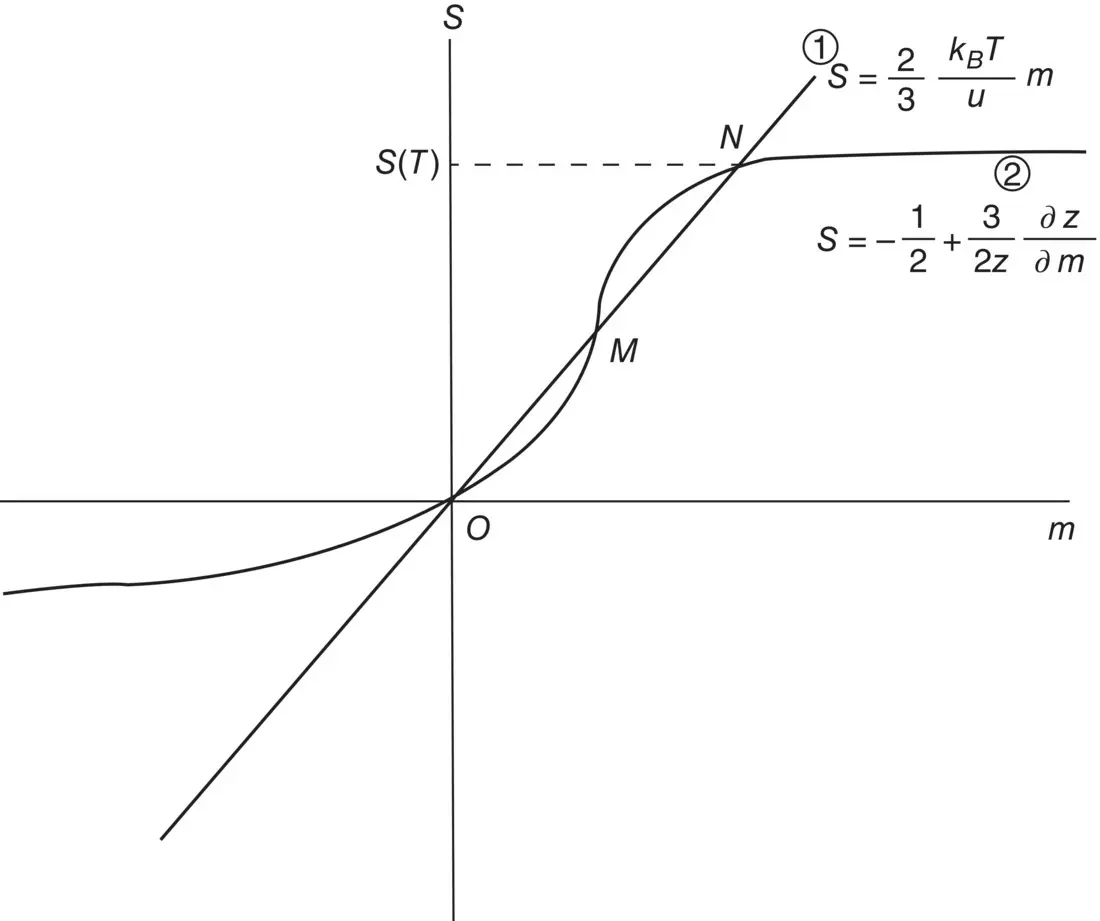
Figure 2.2. Schematic depiction of the numerical solution of the two transcendental equations for the order parameter for T ⩽ T c; there is only one intersection point (at the origin).
(2.20) 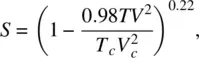
where V and V care the molar volumes at T and T c, respectively.
In spite of some of these predictions, which are in good agreement with the experimental results, the Maier–Saupe theory is not without its shortcomings. For example, the universal temperature dependence of S on T/T cis really not valid [10]; agreement with experimental results requires an improved theory that accounts for the noncylindrical shape of the molecules [8]. The temperature variation given in Eq. (2.20)also cannot account for the critical dependence of the refractive indices. Nevertheless, the Maier–Saupe theory remains an effective, clear, and simple theoretical framework and a starting point for understanding nematic liquid crystal complexities.
2.3.2. Nonequilibrium and Dynamical Dependence of the Order Parameter
While the equilibrium statistical mechanics of the nematic liquid crystal order parameter and related physical properties near T care now well understood, the dynamical responses of the order parameter remain relatively unexplored. This is probably due to the fact that most studies of the order parameter near the phase transition point, such as the critical exponent, changes in molar volume, and other physical parameters, are directed at understanding the phase transition processes themselves and are usually performed with temperature changes occurring at very slow rates.
The temperature of the nematics can be abruptly raised by very short laser pulses [11, 12]. The pulse duration of the laser is in the nanosecond or picosecond time scale, which, as we shall see, is much shorter than the response time of the order parameter. As a result, the nematic film under study exhibits delayed signals.
Figure 2.3a and b shows the observed diffraction from a nematic film in a dynamic grating experiment [11]. As explained in more detail in Chapter 9, the diffracted signal is a measure of the dynamical change in the refractive index, Δ n ( t ), following an instantaneous (delta function like) pump pulse. For a nematic liquid crystal, the principal change in the refractive index associated with a rise in temperature is through the density and order parameter [12]; that is,
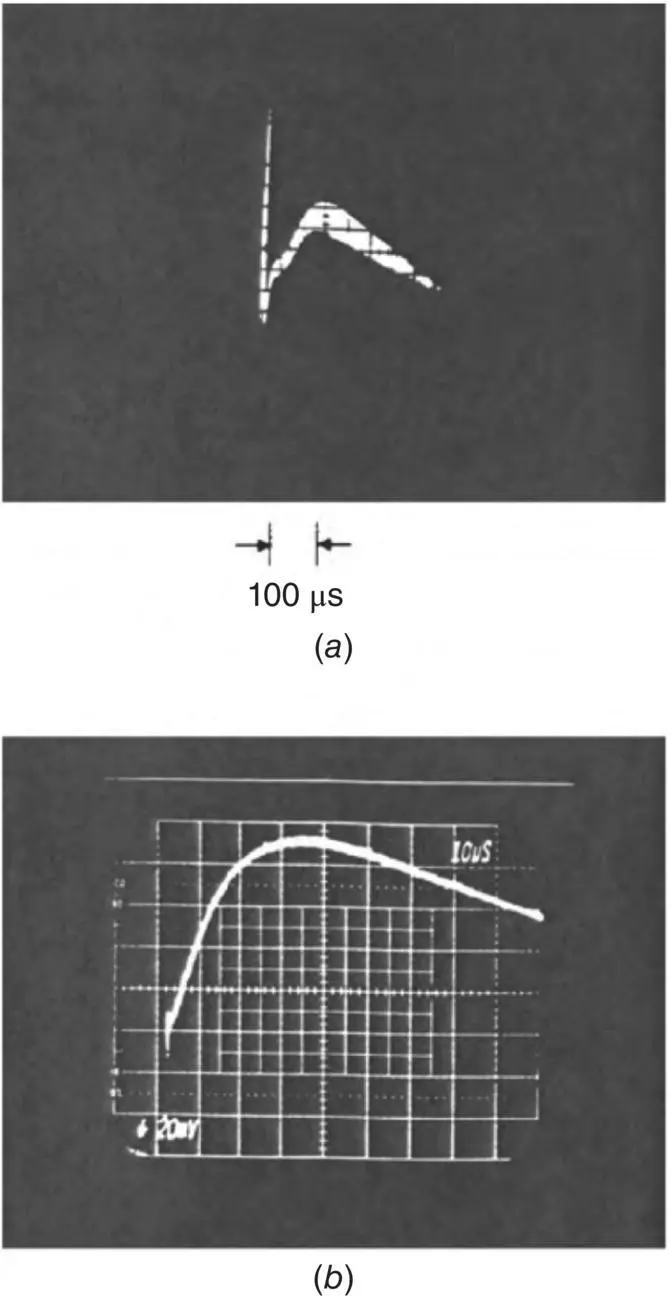
Figure 2.3. (a) Observed oscilloscope trace of the diffracted signal in a dynamical scattering experiment involving microsecond infrared (CO 2at 10.6 μm) laser pump pulses. The sample used is a planar‐aligned nematic (E7) film; (b) observed oscilloscope trace of the diffracted signal from a nematic film under nanosecond visible (Nd:YAG at 0.53 μm) laser pump pulse excitation. The sample used is a planar‐aligned nematic (E7) film.
(2.21) 
Интервал:
Закладка:
Похожие книги на «Liquid Crystals»
Представляем Вашему вниманию похожие книги на «Liquid Crystals» списком для выбора. Мы отобрали схожую по названию и смыслу литературу в надежде предоставить читателям больше вариантов отыскать новые, интересные, ещё непрочитанные произведения.


Обсуждение, отзывы о книге «Liquid Crystals» и просто собственные мнения читателей. Оставьте ваши комментарии, напишите, что Вы думаете о произведении, его смысле или главных героях. Укажите что конкретно понравилось, а что нет, и почему Вы так считаете.