Computational Statistics in Data Science
Здесь есть возможность читать онлайн «Computational Statistics in Data Science» — ознакомительный отрывок электронной книги совершенно бесплатно, а после прочтения отрывка купить полную версию. В некоторых случаях можно слушать аудио, скачать через торрент в формате fb2 и присутствует краткое содержание. Жанр: unrecognised, на английском языке. Описание произведения, (предисловие) а так же отзывы посетителей доступны на портале библиотеки ЛибКат.
- Название:Computational Statistics in Data Science
- Автор:
- Жанр:
- Год:неизвестен
- ISBN:нет данных
- Рейтинг книги:4 / 5. Голосов: 1
-
Избранное:Добавить в избранное
- Отзывы:
-
Ваша оценка:
Computational Statistics in Data Science: краткое содержание, описание и аннотация
Предлагаем к чтению аннотацию, описание, краткое содержание или предисловие (зависит от того, что написал сам автор книги «Computational Statistics in Data Science»). Если вы не нашли необходимую информацию о книге — напишите в комментариях, мы постараемся отыскать её.
Computational Statistics in Data Science
Computational Statistics in Data Science
Wiley StatsRef: Statistics Reference Online
Computational Statistics in Data Science
Computational Statistics in Data Science — читать онлайн ознакомительный отрывок
Ниже представлен текст книги, разбитый по страницам. Система сохранения места последней прочитанной страницы, позволяет с удобством читать онлайн бесплатно книгу «Computational Statistics in Data Science», без необходимости каждый раз заново искать на чём Вы остановились. Поставьте закладку, и сможете в любой момент перейти на страницу, на которой закончили чтение.
Интервал:
Закладка:
The directed edges in the network represent weights from a node in one layer to another node in the next layer. We denote the weight from a node  in the input layer to a node
  in the hidden layer as
  . The weight from a node
  in the hidden layer to a node
  in the output layer will be denoted
  . In each of the input and hidden layers, we introduce intercept nodes , denoted
  and
and  , respectively. Weights from them to any other node are called biases . Each node in a given layer is connected by a weight to every node in the layer above except the intercept node.
The value of each node in the hidden and output layers is determined as a nonlinear transformation of the linear combination of the values of the nodes in the previous layers and the weights from each of those nodes to the node of interest. That is, the value of  ,
,  , is given by
  , where
 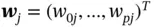 ,
,  , and
, and  is a nonlinear transformation with range in the interval
  . Similarly, the value of
  ,
,  , is given by
  , where
 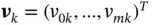 ,
,  , and
, and  is also a nonlinear transformation with a range in the interval
  .
.
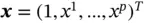
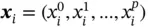
More formally, the map  provided by an MLP from a sample
  to
to  can be written as follows:
where  ,
,  ,
,  , and
, and  and
and  are nonlinear functions.
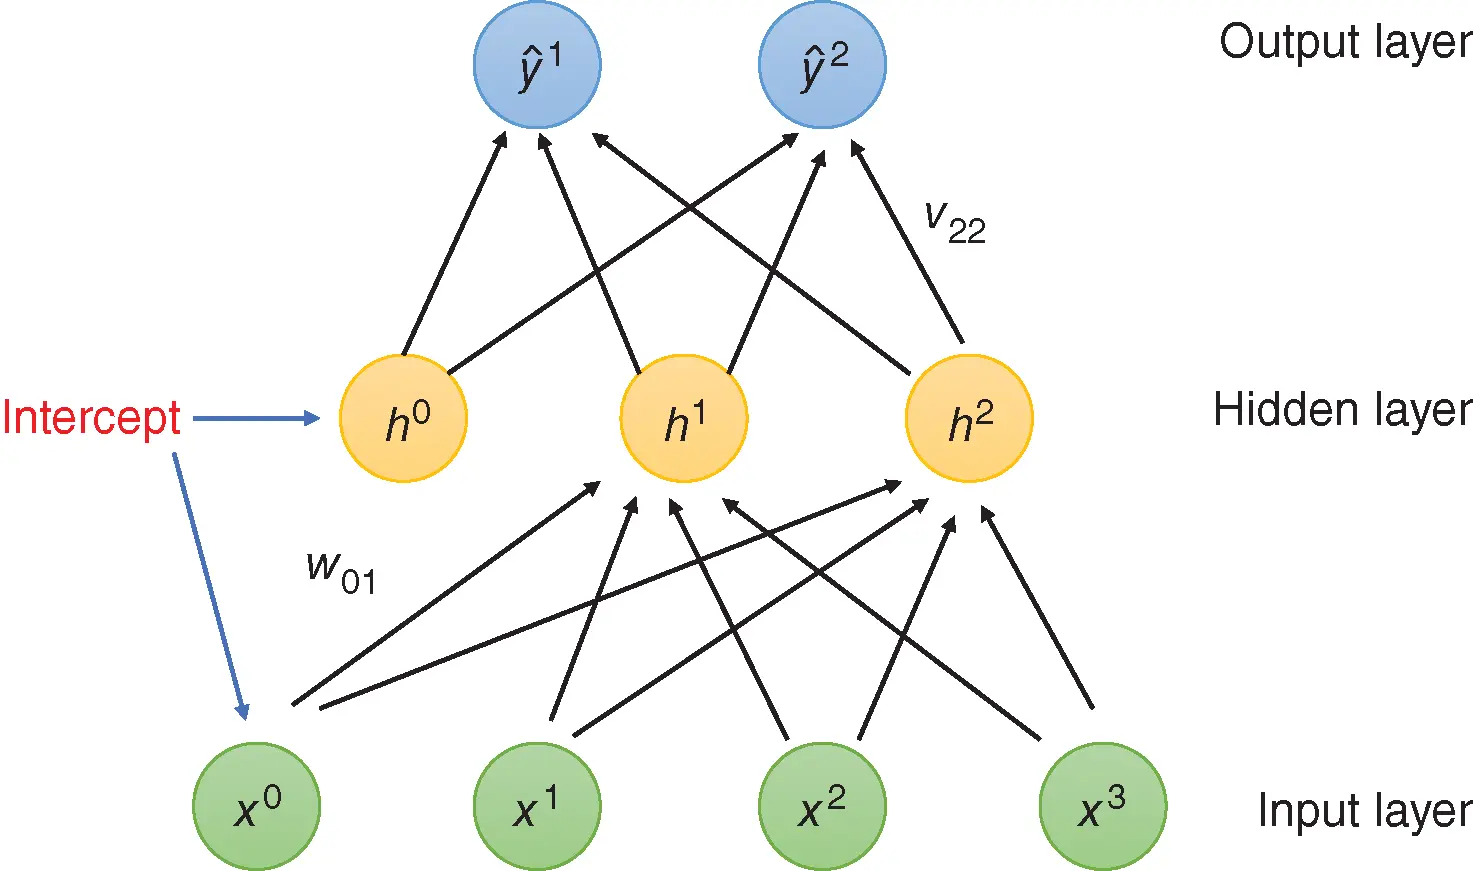
Figure 1 An MLP with three layers.
Most often,  and
and  are chosen to be the logistic function
  . This function is often chosen for the following desirable properties: (i) it is highly nonlinear, (ii) it is monotonically increasing, (iii) it is asymptotically bounded at some finite value in both the negative and positive directions, and (iv) its output lies in the interval
  , so that it stays relatively close to 0. However, Yann LeCun recommends that a different function be used:
 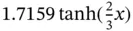 . This function retains all of the desirable properties of the logistic function and has the additional advantage of being symmetric about the origin, which results in outputs closer to 0 than the logistic function.
Интервал:
Закладка:
Похожие книги на «Computational Statistics in Data Science»
Представляем Вашему вниманию похожие книги на «Computational Statistics in Data Science» списком для выбора. Мы отобрали схожую по названию и смыслу литературу в надежде предоставить читателям больше вариантов отыскать новые, интересные, ещё непрочитанные произведения.
![Роман Зыков - Роман с Data Science. Как монетизировать большие данные [litres]](/books/438007/roman-zykov-roman-s-data-science-kak-monetizirova-thumb.webp)


Обсуждение, отзывы о книге «Computational Statistics in Data Science» и просто собственные мнения читателей. Оставьте ваши комментарии, напишите, что Вы думаете о произведении, его смысле или главных героях. Укажите что конкретно понравилось, а что нет, и почему Вы так считаете.