Computational Statistics in Data Science
Здесь есть возможность читать онлайн «Computational Statistics in Data Science» — ознакомительный отрывок электронной книги совершенно бесплатно, а после прочтения отрывка купить полную версию. В некоторых случаях можно слушать аудио, скачать через торрент в формате fb2 и присутствует краткое содержание. Жанр: unrecognised, на английском языке. Описание произведения, (предисловие) а так же отзывы посетителей доступны на портале библиотеки ЛибКат.
- Название:Computational Statistics in Data Science
- Автор:
- Жанр:
- Год:неизвестен
- ISBN:нет данных
- Рейтинг книги:4 / 5. Голосов: 1
-
Избранное:Добавить в избранное
- Отзывы:
-
Ваша оценка:
Computational Statistics in Data Science: краткое содержание, описание и аннотация
Предлагаем к чтению аннотацию, описание, краткое содержание или предисловие (зависит от того, что написал сам автор книги «Computational Statistics in Data Science»). Если вы не нашли необходимую информацию о книге — напишите в комментариях, мы постараемся отыскать её.
Computational Statistics in Data Science
Computational Statistics in Data Science
Wiley StatsRef: Statistics Reference Online
Computational Statistics in Data Science
Computational Statistics in Data Science — читать онлайн ознакомительный отрывок
Ниже представлен текст книги, разбитый по страницам. Система сохранения места последней прочитанной страницы, позволяет с удобством читать онлайн бесплатно книгу «Computational Statistics in Data Science», без необходимости каждый раз заново искать на чём Вы остановились. Поставьте закладку, и сможете в любой момент перейти на страницу, на которой закончили чтение.
Интервал:
Закладка:
Machine learning methods are grouped into two main categories, based on what they aim to achieve. The first category is known as supervised learning . In supervised learning, each observation in a dataset comes attached with a label . The label, similar to a response variable, may represent a particular class the observation belongs to (categorical response) or an output value (real‐valued response). In either case, the ultimate goal is to make inferences on possibly unlabeled observations outside of the given dataset. Prediction and classification are both problems that fall into the supervised learning category. The second category is known as unsupervised learning . In unsupervised learning, the data come without labels, and the goal is to find a pattern within the data at hand. Unsupervised learning encompasses the problems of clustering, density estimation, and dimension reduction.
2.2 Supervised Learning
Here, we state the problem of supervised learning explicitly. We have a set of training data 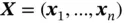 , where
  for all
  , and a corresponding set of labels
 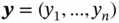 , which can represent either a category membership or a real‐valued response. We aim to construct a function
 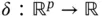 that maps each input
  to a predicted label
  . A given supervised learning method
  chooses a particular form
 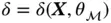 , where
  is a vector of parameters based on
  .
.
We wish to choose  to minimize an error function
  . The error function is most commonly taken to be the sum of square errors in which case the goal is to choose an optimal
  such that
where  can be any loss function that evaluates the distance between
  and
and  , such as cross‐entropy loss and square loss.
2.3 Gradient Descent
The form of the function  will usually be fairly complex, so attempting to find
  via direct differentiation will not be feasible. Instead, we use gradient descent to minimize the error function.
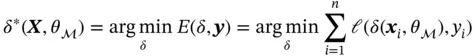
Gradient descent is a general optimization algorithm that can be used to find the minimizer of any given function. We pick an arbitrary starting point, and then at each time point, we take a small step in the direction of the greatest decrease, which is given by the gradient. The idea is that if we repeatedly do this, we will eventually arrive at a minimum. The algorithm guarantees a local minimum, but not necessarily a global one [4]; see Algorithm 1.
Gradient descent is often very slow in machine learning applications, as finding the true gradient of the error criterion usually involves iterating through the entire dataset. Since we need to calculate the gradient at each time step of the algorithm, this leads to having to iterate through the entire dataset a very large number of times. To speed up the process, we instead use a variation on gradient descent known as stochastic gradient descent . Stochastic gradient descent involves approximating the gradient at each time step with the gradient at a single observation, which significantly speeds up the process [5]; see Algorithm 2.

3 Feedforward Neural Networks
3.1 Introduction
A feedforward neural network, also known as a multilayer perceptron (MLP), is a popular supervised learning method that provides a parameterized form for the nonlinear map  from an input to a predicted label [6]. The form of
  here can be depicted graphically as a directed layered network, where the directed edges go upward from nodes in one layer to nodes in the next layer. The neural network has been seen to be a very powerful model, as they are able to approximate any Borel measurable function to an arbitrary degree, provided that parameters are chosen correctly.
3.2 Model Description
We start by describing a simple MLP with three layers, as depicted in Figure 1.
The bottom layer of a three‐layer MLP is called the input layer , with each node representing the respective elements of an input vector. The top layer is known as the output layer and represents the final output of the model, a predicted vector. Again, each node in the output layer represents the respective predicted score of different classes. The middle layer is called the hidden layer and captures the unobserved latent features of the input. This is the only layer where the number of nodes is determined by the user of the model, rather than the problem itself.
Читать дальшеИнтервал:
Закладка:
Похожие книги на «Computational Statistics in Data Science»
Представляем Вашему вниманию похожие книги на «Computational Statistics in Data Science» списком для выбора. Мы отобрали схожую по названию и смыслу литературу в надежде предоставить читателям больше вариантов отыскать новые, интересные, ещё непрочитанные произведения.
![Роман Зыков - Роман с Data Science. Как монетизировать большие данные [litres]](/books/438007/roman-zykov-roman-s-data-science-kak-monetizirova-thumb.webp)


Обсуждение, отзывы о книге «Computational Statistics in Data Science» и просто собственные мнения читателей. Оставьте ваши комментарии, напишите, что Вы думаете о произведении, его смысле или главных героях. Укажите что конкретно понравилось, а что нет, и почему Вы так считаете.