Handbook of Aggregation-Induced Emission, Volume 2
Здесь есть возможность читать онлайн «Handbook of Aggregation-Induced Emission, Volume 2» — ознакомительный отрывок электронной книги совершенно бесплатно, а после прочтения отрывка купить полную версию. В некоторых случаях можно слушать аудио, скачать через торрент в формате fb2 и присутствует краткое содержание. Жанр: unrecognised, на английском языке. Описание произведения, (предисловие) а так же отзывы посетителей доступны на портале библиотеки ЛибКат.
- Название:Handbook of Aggregation-Induced Emission, Volume 2
- Автор:
- Жанр:
- Год:неизвестен
- ISBN:нет данных
- Рейтинг книги:4 / 5. Голосов: 1
-
Избранное:Добавить в избранное
- Отзывы:
-
Ваша оценка:
Handbook of Aggregation-Induced Emission, Volume 2: краткое содержание, описание и аннотация
Предлагаем к чтению аннотацию, описание, краткое содержание или предисловие (зависит от того, что написал сам автор книги «Handbook of Aggregation-Induced Emission, Volume 2»). Если вы не нашли необходимую информацию о книге — напишите в комментариях, мы постараемся отыскать её.
, the editors address the design and synthesis of typical AIEgens that have made significant contributions to aggregation-induced emission research. Recent advances in the development of aggregation-induced emission systems are discussed and the book covers novel aggregation-induced emission systems in small molecule organogels, polymersomes, metal-organic coordination complexes and metal nanoclusters. Readers will also discover:
A thorough introduction to the synthesis and applications of tetraphenylpyrazine-based AIEgens, AIEgens based on 9,10-distyrylanthracene , and the Salicylaldehyde Schiff base Practical discussions of aggregation-induced emission from the sixth main group and fluorescence detection of dynamic aggregation processes using AIEgens Coverage of cyclic triimidazole derivatives and the synthesis of multi-phenyl-substituted pyrrole based materials and their applications Perfect for academic researchers working on aggregation-induced emission, this set of volumes is also ideal for professionals and students in the fields of photophysics, photochemistry, materials science, optoelectronic materials, synthetic organic chemistry, macromolecular chemistry, polymer science, and biological sciences.
Handbook of Aggregation-Induced Emission, Volume 2 — читать онлайн ознакомительный отрывок
Ниже представлен текст книги, разбитый по страницам. Система сохранения места последней прочитанной страницы, позволяет с удобством читать онлайн бесплатно книгу «Handbook of Aggregation-Induced Emission, Volume 2», без необходимости каждый раз заново искать на чём Вы остановились. Поставьте закладку, и сможете в любой момент перейти на страницу, на которой закончили чтение.
Интервал:
Закладка:
Liu et al. synthesized SSB AIE Cu 2+probes 5and 6. Compared to the dispersed state, the fluorescence enhancement factors of the two probes in poor solvents are about 300‐ and 34‐folds, respectively. After adding Cu 2+, the emission intensities of 5and 6were significantly reduced [14]. The fluorescence of the solution changed from green to colorless under a 365‐nm UV lamp, and the detection limits for copper ions were 200 ± 23 and 10 ± 0.3 nM. Through dynamic light scattering (DLS) analysis, scanning electron microscopy (SEM), proton nuclear magnetic resonance ( 1H‐NMR) titration, electrospray ionization‐mass spectrometry (ESI‐MS), and other analytical methods, it was found that after adding Cu 2+, the imine bonds in 5and 6coordinate with the copper ions, under the strong chelation‐enhanced fluorescence quenching (CHEQ); the rigid probe aggregates are bent and rearranged to form a fluorescent‐quenched complex ( Figure 3.5A). After adding excess EDTA, the fluorescence of the system could not be recovered, indicating the irreversibility of the process. Subsequently, 5and 6(10 μM) were applied to intracellular Cu 2+detection. The probe showed a strong green fluorescence under confocal microscope, and an obvious turn‐off was observed after Cu 2+was added, indicating the good cell membrane permeability and intracellular Cu 2+detection ability of the probe ( Figure 3.5C).
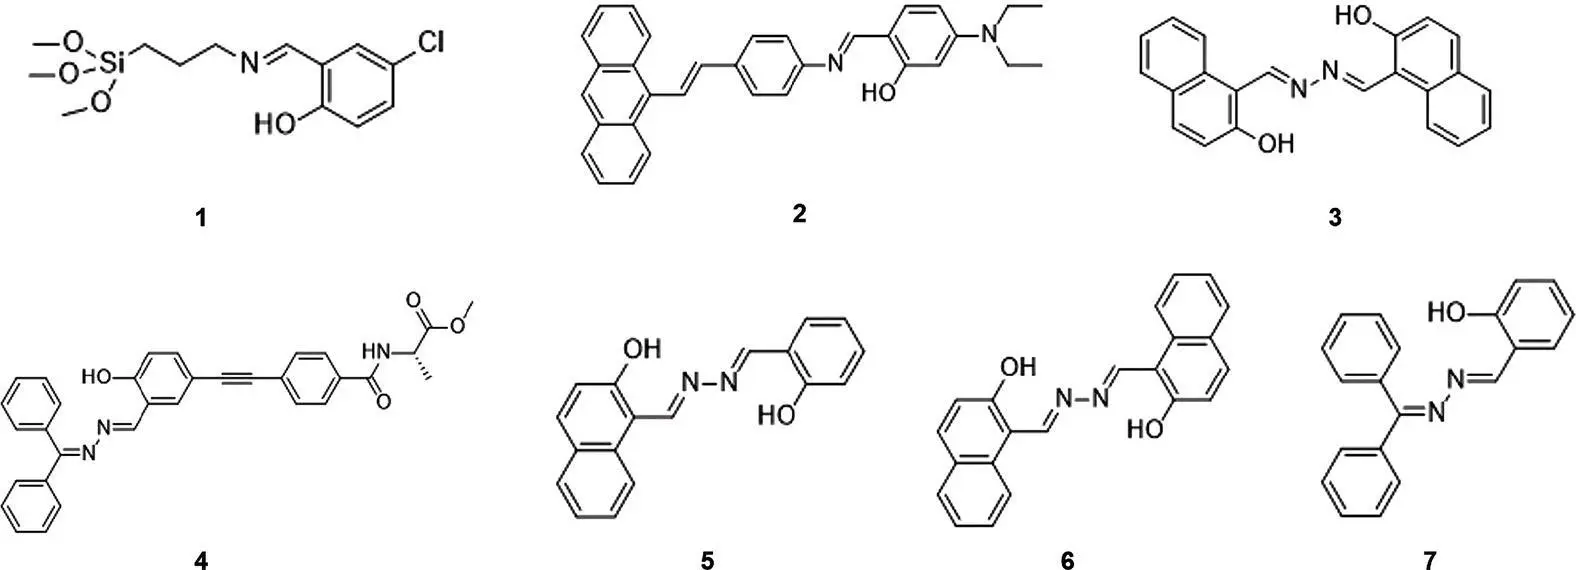
Figure 3.3 Chemical structures of typical turn‐off metal ion probes 1– 7.
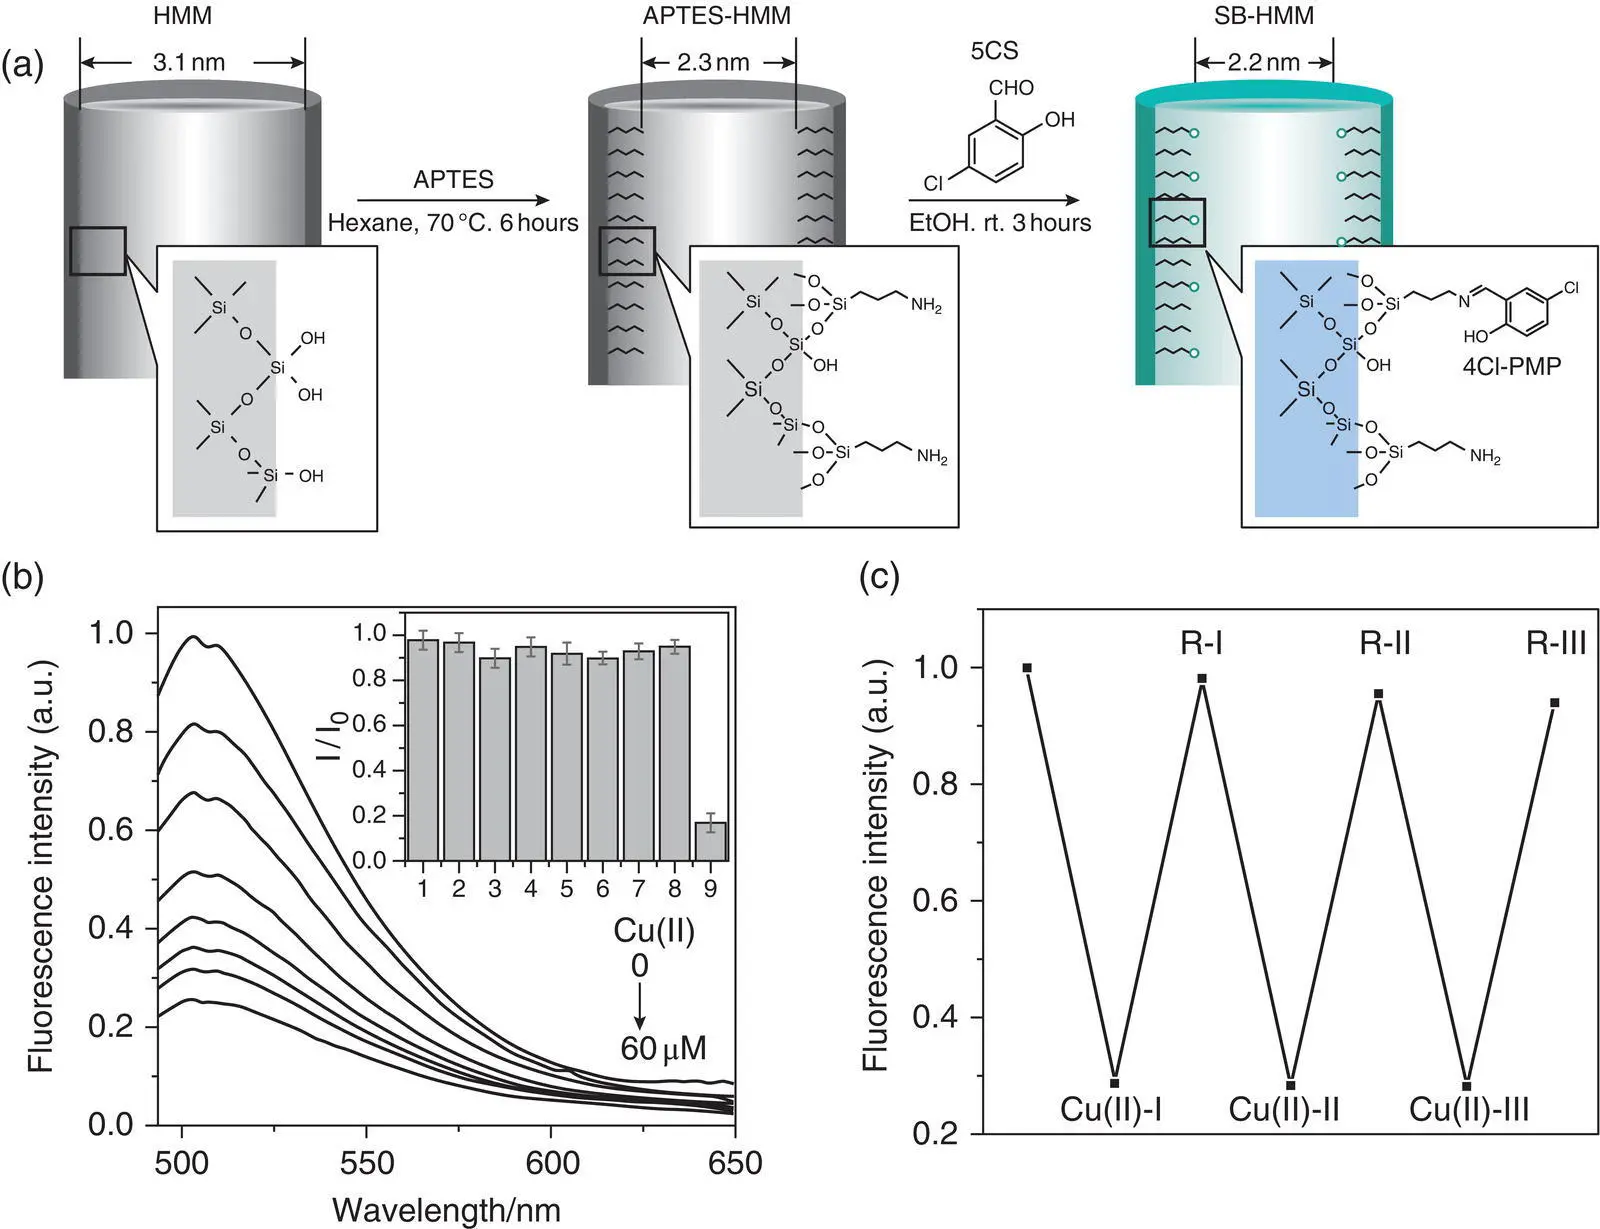
Figure 3.4 (a) Scheme for immobilization of 4‐chloro‐2‐[(propylimino) methyl]‐phenol (4Cl‐PMP) groups on the surface of mesoporous silica in hybrid mesoporous membranes (HMM, (3‐aminopropyl)triethoxysilane (APTES)‐HMM, SB‐HMM). (b) Fluorescence spectra of SB‐HMM upon the addition of Cu 2+(0, 5, 10, 20, 30, 40, 50, and 60 M). The inset shows the changes in the fluorescence intensities of SB‐HMM with and without Cu 2+and other metal ions (80 (M): 1, K +; 2, Ca 2+; 3, Fe 2+; 4, Fe3 +; 5, Zn 2+; 6, Ni 2+; 7, Cd 2+; 8, Pb 2+; and 9, Cu 2+. I 0and I are the excitation peak intensities of SB‐HMM without and with metal ions, respectively. (c) Regeneration/reuse cycles for SB‐HMM upon the addition of 80 M Cu 2+.
Source: Reprinted from Ref. [16] (Copyright 2011 Elsevier B.V.).
The fluorescence turn‐on metal ion probe emits no fluorescence or weak fluorescence and fluoresces strongly after interacting with metal ions. Compared with fluorescence turn‐off probes, the background fluorescence is weaker and thus higher signal‐to‐noise ratio and sensitivity, which is more preferable for the detection of metal ions in biological environments [17]. Most SSB turn‐on metal ion probes are mainly reported for Zn 2+detection. The specific molecular structures are summarized in Figure 3.6, as shown below. Probes 8–13 are zinc ion detection probes, and probes 14–16 are used for the detection of Al 3+, Cu 2+, and Ca 2+, respectively [8,17–25].
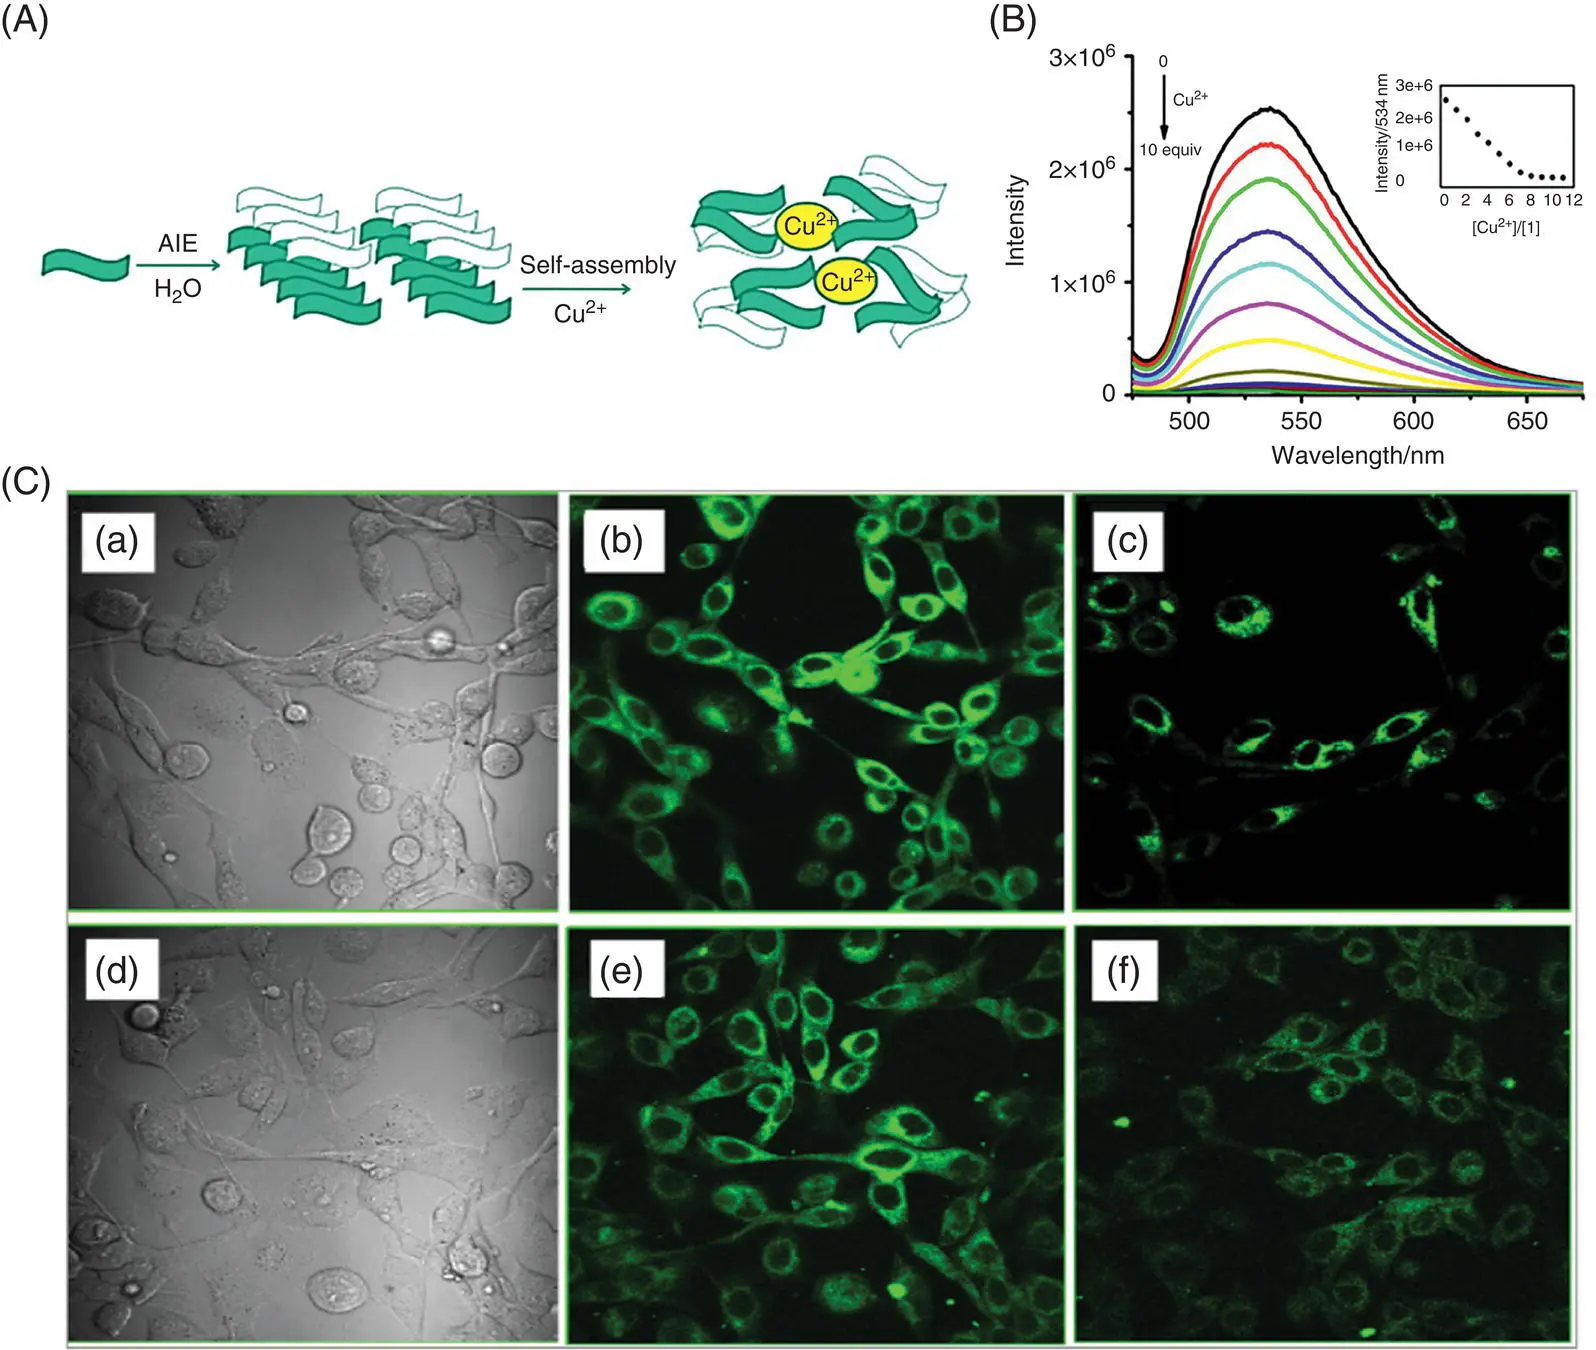
Figure 3.5 (A) Proposed mechanism for AIE and self‐assembly of 5 or 6 by Cu 2+. (B) Fluorescence spectra of probe 5 upon the addition of 0–10 equiv. Cu 2+. Inset: Changes of intensity at 534 nm with [Cu 2+]/[5]. (C) Human esophageal squamous KYSE510: (a) bright‐field image of cells incubated with 10 μM 5 for 30 minutes, (b) fluorescence image of 5, (c) fluorescence image of 5 in the presence 100 μM Cu 2+for 15 minutes, (d) bright‐field image of cells incubated with 10 μM 6 for 30 minutes, (e) fluorescence image of 6, (f) fluorescence image of 6 in the presence of 100 μM Cu 2+for 15 minutes at 37 °C.
Source: Reprinted from Ref. [14] (Copyright 2017 Elsevier B.V.).
Tong et al. reported a Zn 2+fluorescence turn‐on probe 8based on SSB [24] ( Figure 3.7). In a 99% water/DMSO mixed solvent, according to the gradual increase of the Zn 2+concentration, the absorption peaks at 310 and 346 nm in the UV absorption spectrum gradually decreased and the newly generated absorption peaks at 333 and 383 nm gradually increased. In the fluorescence titration performed under the same conditions, the initial fluorescence of the solution was very weak. With the addition of zinc ions, a gradually increasing fluorescence peak appeared at 460 nm, and its saturated fluorescence intensity reached 22‐folds compared with the initial intensity. A bright blue fluorescence was observed under UV light. Job's plot and ESI–MS results gave the binding ratio of the probe to the metal ion as 1 : 1, and the binding constant was calculated as 5 × 10 4l/mol. The effects of different substituents of salicylaldehyde derivatives were studied by synthesizing various analogues of probe 8. At neutral pH, all substituted derivatives other than 4‐ N,N ‐diethylamine salicylaldehyde containing a strong electron‐donating group showed fluorescence turn‐on with zinc ions after condensation reaction with 2‐hydrazinopyridine. Among them, probe 8exhibits the highest fluorescence enhancement and longer fluorescence emission wavelength. Under pH = 7, the detection linear range is 0.1–1 μM, and the detection limit is 30 nM. Immunity experiments show that only paramagnetic Cu 2+and Co 2+ions cause fluorescence quenching and affect zinc ion detection. Intracellular imaging of zinc ions was performed in HeLa cells, and significant intracellular fluorescence enhancement was observed under a confocal microscope.
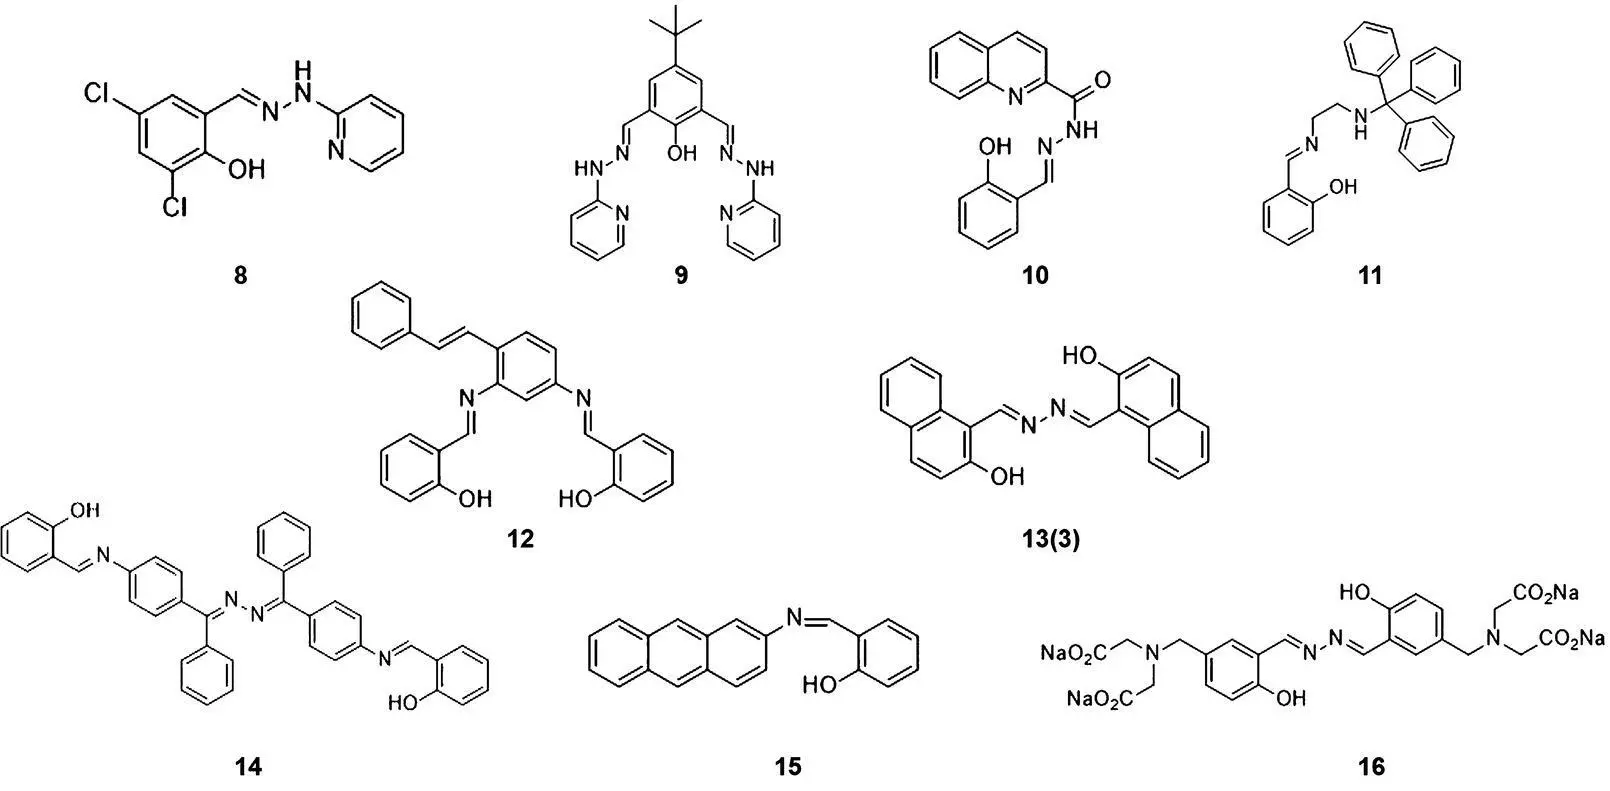
Figure 3.6 Chemical structures of typical turn‐on SSB metal ion probes 8– 16.
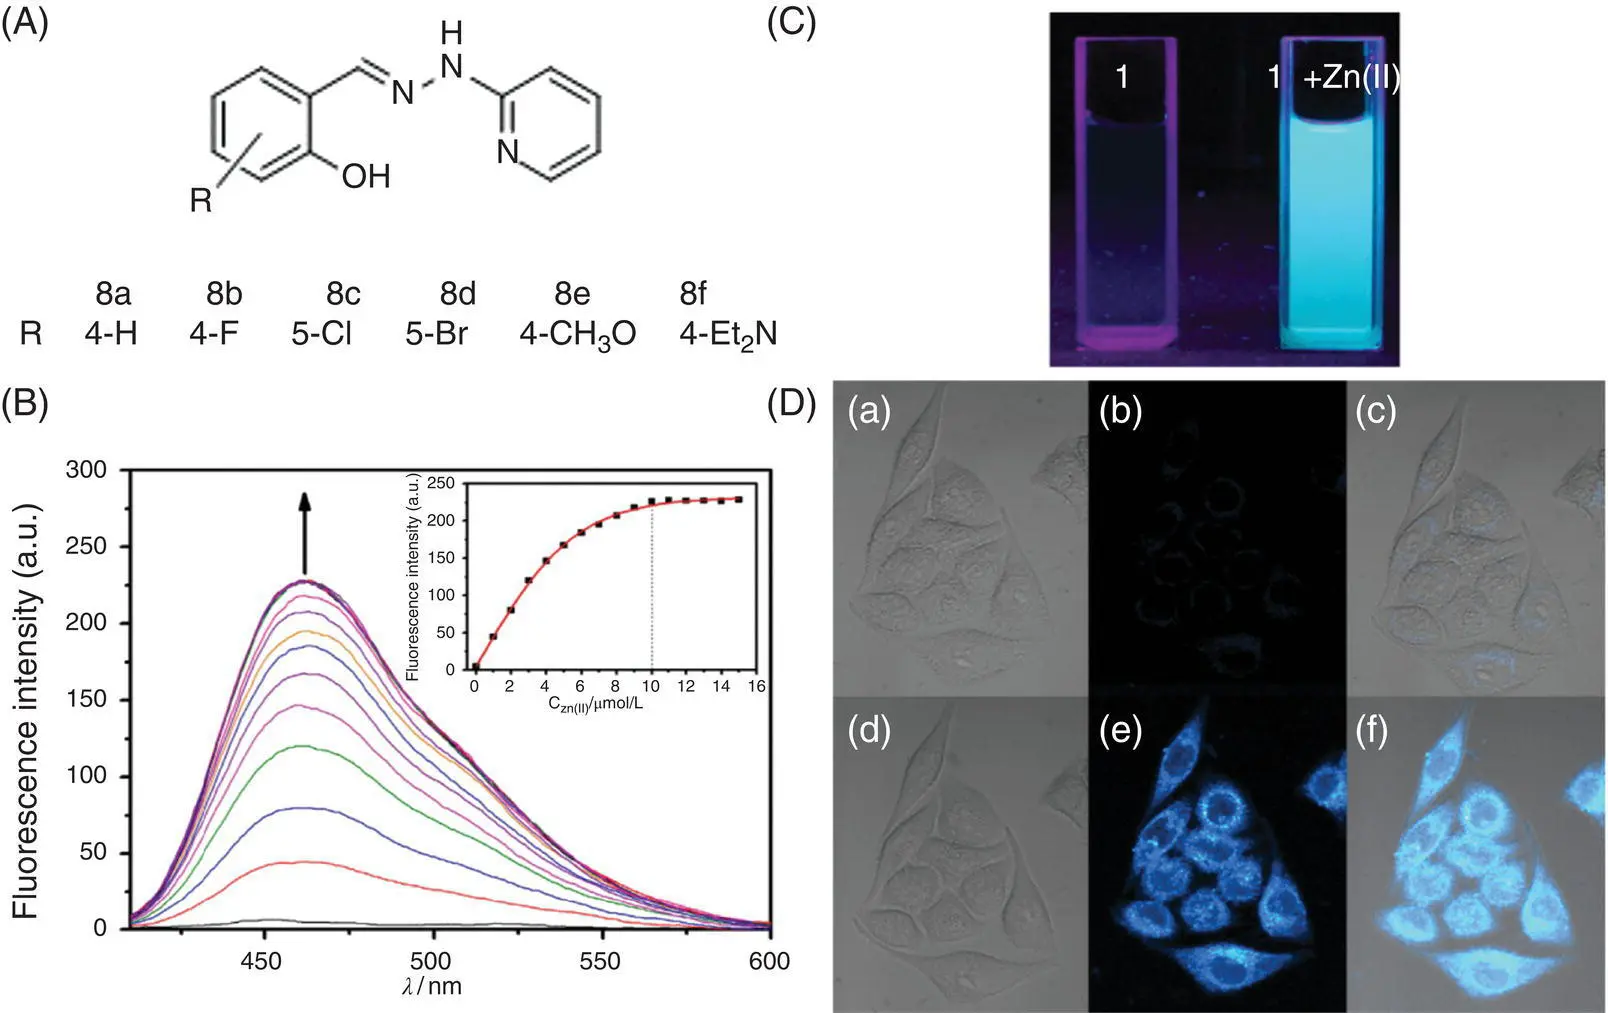
Figure 3.7 (A) Chemical structures of 8analogues: 8a–f. (B) Fluorescence spectra of 10 mol/l 8upon the addition of 0–15 mol/l Zn 2+. Inset: the fluorescence intensity at 460 nm as a function of the Zn 2+concentration; excitation was at 364 nm. (C) Fluorescence images of probe 8before and after adding zinc ion under UV light. The photographs on the right side show 8in the absence and presence of 8 equiv. Zn 2+in a glass cuvette excited by sunlight and UV light (365 nm). (D) Fluorescence images of live HeLa cells. From left to right are bright‐field images, fluorescence images, and overlay images. Top (a–c): cells were incubated with 8for 20 minutes and washed with TBS twice. Bottom (d–f): cells were incubated with 8and then with Zn 2+(10 mol/l) and pyrithione (10 mol/l) for 20 minutes and washed with TBS twice. Emission was collected at 430–490 nm upon excitation at 405 nm.
Source: Reprinted from Ref. [24] (Copyright 2013 Elsevier B.V.).
Читать дальшеИнтервал:
Закладка:
Похожие книги на «Handbook of Aggregation-Induced Emission, Volume 2»
Представляем Вашему вниманию похожие книги на «Handbook of Aggregation-Induced Emission, Volume 2» списком для выбора. Мы отобрали схожую по названию и смыслу литературу в надежде предоставить читателям больше вариантов отыскать новые, интересные, ещё непрочитанные произведения.


Обсуждение, отзывы о книге «Handbook of Aggregation-Induced Emission, Volume 2» и просто собственные мнения читателей. Оставьте ваши комментарии, напишите, что Вы думаете о произведении, его смысле или главных героях. Укажите что конкретно понравилось, а что нет, и почему Вы так считаете.