Anthony R. West - Solid State Chemistry and its Applications
Здесь есть возможность читать онлайн «Anthony R. West - Solid State Chemistry and its Applications» — ознакомительный отрывок электронной книги совершенно бесплатно, а после прочтения отрывка купить полную версию. В некоторых случаях можно слушать аудио, скачать через торрент в формате fb2 и присутствует краткое содержание. Жанр: unrecognised, на английском языке. Описание произведения, (предисловие) а так же отзывы посетителей доступны на портале библиотеки ЛибКат.

- Название:Solid State Chemistry and its Applications
- Автор:
- Жанр:
- Год:неизвестен
- ISBN:нет данных
- Рейтинг книги:4 / 5. Голосов: 1
-
Избранное:Добавить в избранное
- Отзывы:
-
Ваша оценка:
Solid State Chemistry and its Applications: краткое содержание, описание и аннотация
Предлагаем к чтению аннотацию, описание, краткое содержание или предисловие (зависит от того, что написал сам автор книги «Solid State Chemistry and its Applications»). Если вы не нашли необходимую информацию о книге — напишите в комментариях, мы постараемся отыскать её.
A comprehensive treatment of solid state chemistry complete with supplementary material and full colour illustrations from a leading expert in the field. Solid State Chemistry and its Applications, Second Edition
Student Edition
Significant updates and new content in this second edition include:
A more extensive overview of important families of inorganic solids including spinels, perovskites, pyrochlores, garnets, Ruddlesden-Popper phases and many more New methods to synthesise inorganic solids, including sol-gel methods, combustion synthesis, atomic layer deposition, spray pyrolysis and microwave techniques Advances in electron microscopy, X-ray and electron spectroscopies New developments in electrical properties of materials, including high Tc superconductivity, lithium batteries, solid oxide fuel cells and smart windows Recent developments in optical properties, including fibre optics, solar cells and transparent conducting oxides Advances in magnetic properties including magnetoresistance and multiferroic materials Homogeneous and heterogeneous ceramics, characterization using impedance spectroscopy Thermoelectric materials, MXenes, low dimensional structures, memristors and many other functional materials Expanded coverage of glass, including metallic and fluoride glasses, cement and concrete, geopolymers, refractories and structural ceramics Overview of binary oxides of all the elements, their structures, properties and applications Featuring full color illustrations throughout, readers will also benefit from online supplementary materials including access to CrystalMaker® software and over 100 interactive crystal structure models.
Perfect for advanced students seeking a detailed treatment of solid state chemistry, this new edition of
will also earn a place as a desk reference in the libraries of experienced researchers in chemistry, crystallography, physics, and materials science.
Solid State Chemistry and its Applications — читать онлайн ознакомительный отрывок
Ниже представлен текст книги, разбитый по страницам. Система сохранения места последней прочитанной страницы, позволяет с удобством читать онлайн бесплатно книгу «Solid State Chemistry and its Applications», без необходимости каждый раз заново искать на чём Вы остановились. Поставьте закладку, и сможете в любой момент перейти на страницу, на которой закончили чтение.
Интервал:
Закладка:
(1.5) 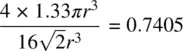
Similar results are obtained for hcp by considering the contents and volume of the appropriate hexagonal unit cell, Fig. 1.21.
In non‐ cp structures, densities lower than 0.7405 are obtained, e.g. the density of body centred cubic, bcc, is 0.6802 (to calculate this it is necessary to know that the cp directions in bcc are parallel to the body diagonals, <111>, of the cube).
1.14 Unit Cell Projections and Atomic Coordinates
In order to give 3D perspective to crystal structures, they are often drawn as oblique projections, as in Fig. 1.20(a). For accurate and unambiguous descriptions, it is necessary, however, to project them down particular crystallographic directions and/or onto unit cell faces, as shown for a face centred cube in Fig. 1.22(b) projected down the z axis onto the ab unit cell face. In this representation, the structure is projected onto a plane and so all sense of vertical perspective is lost. In order to restore some vertical perspective and to specify atomic positions fully, their vertical height in the unit cell is given, in this case as a fraction of c , beside each atom. It is not necessary to specify the x, y coordinates of each atom if the structure is drawn to scale; in this projection (b), the origin is shown as the top left‐hand corner. There are two atoms at each corner, with z coordinates of 0 and 1. Similarly, atoms at the top and bottom face centres are shown with z = 0, 1 in the middle of the projection. The four side face centre positions are shown as single circles, each with z = ½.
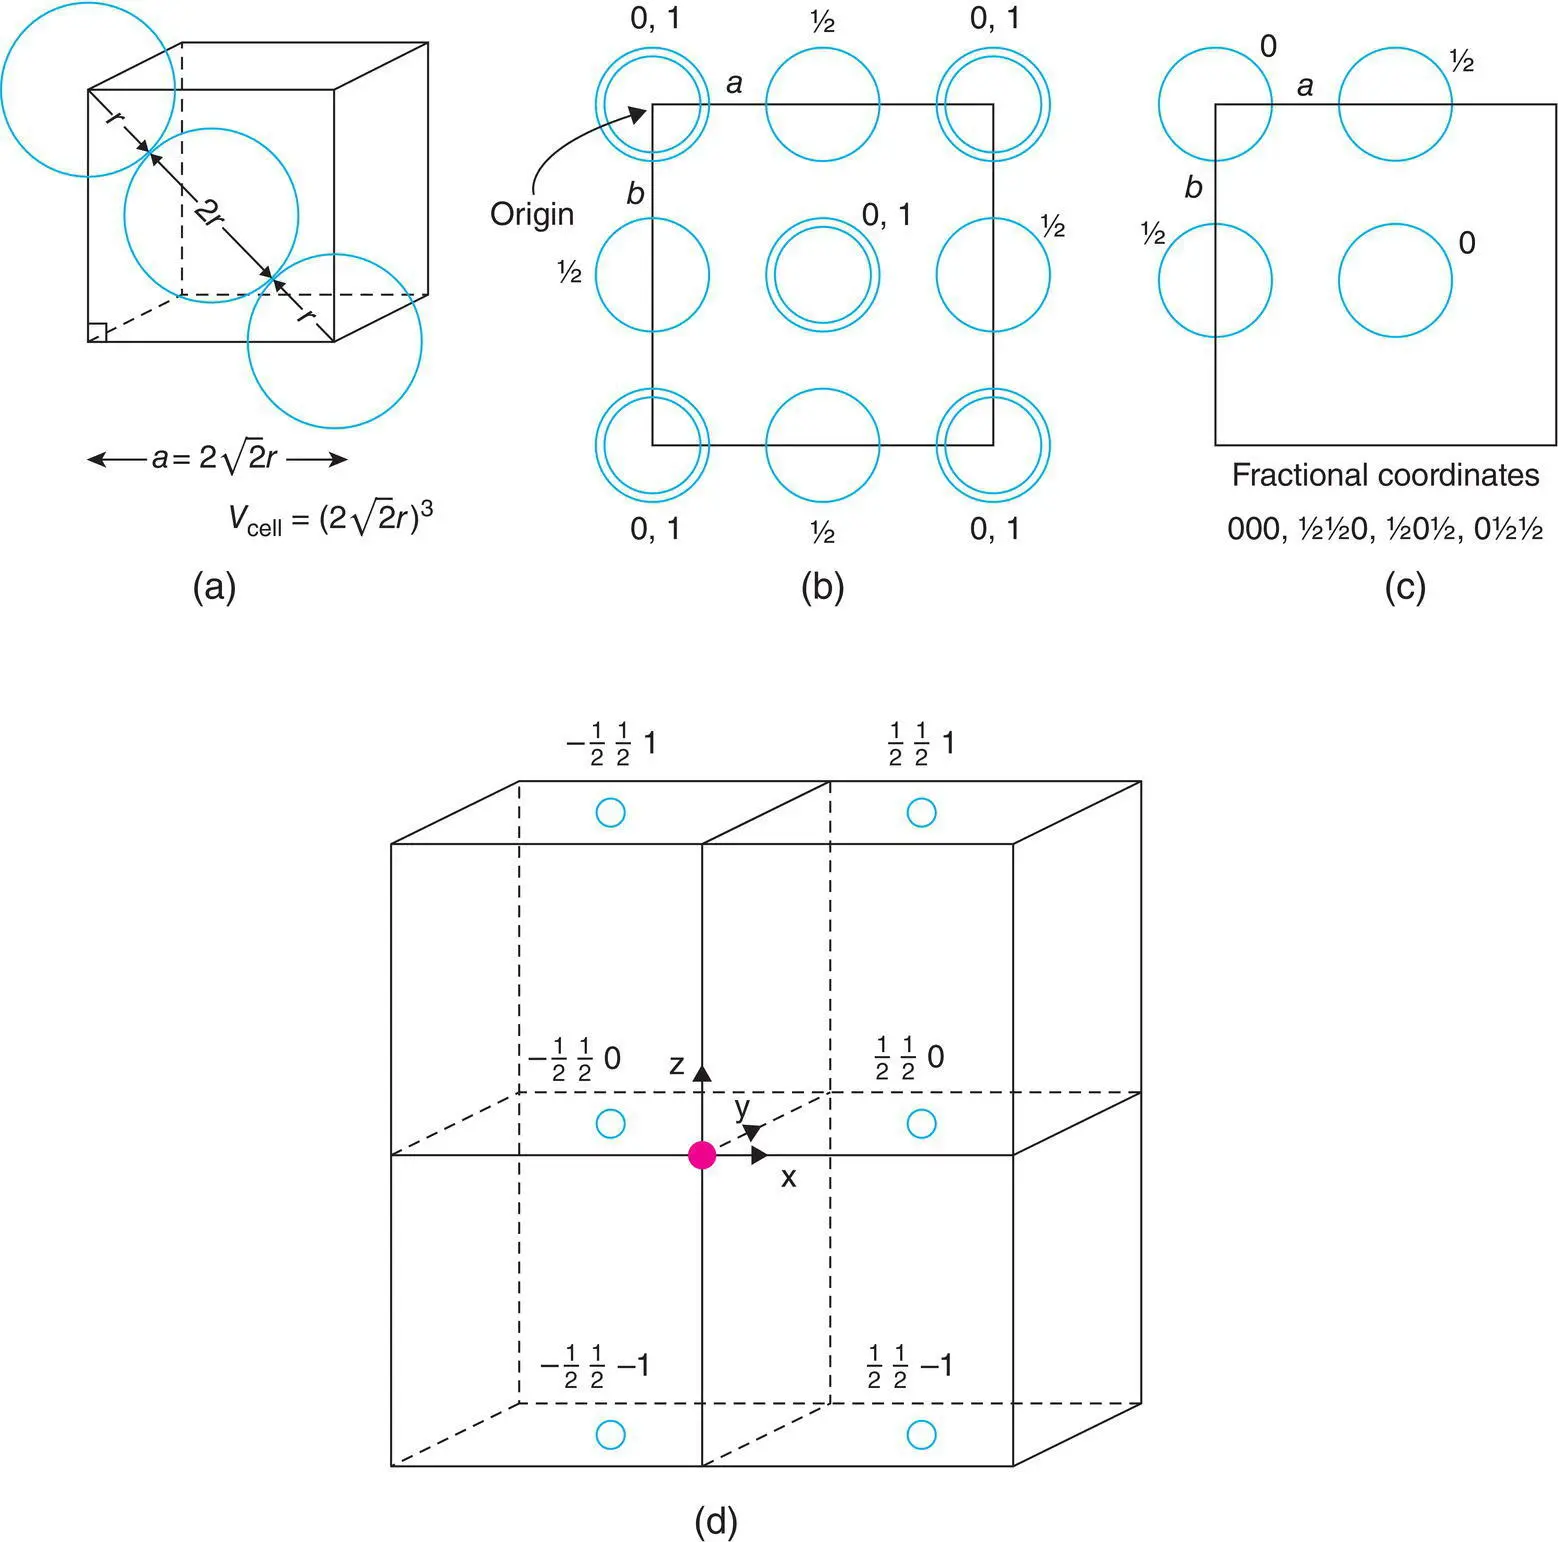
Figure 1.22 (a) Unit cell dimensions for a face centred cubic unit cell with spheres of radius r in contact along face diagonals. (b) Projection of a face centred cubic structure onto a unit cell face. (c) Unit cell contents. (d) Positive and negative atomic coordinates of the C face centre positions in four adjacent unit cells are given.
It is important to be able to use diagrams such as that in Fig. 1.22(b) and to relate these to listings of fractional atomic coordinates. Thus, a face centred cube contains, effectively, four positions in the unit cell, one corner and three face centres; their coordinates are 000, ½½0, ½0½, 0½½: each coordinate specifies the fractional distance of the atom from the origin in the directions a, b and c , respectively of the unit cell. These four positions are shown in Fig. 1.22(c) and it should be clear that the more complete structure shown in (b) is obtained simply by the addition of extra, equivalent positions in adjacent unit cells.
The diagrams in Fig. 1.22(b) and (c) both, therefore, represent the unit cell of a face centred cube; if we wish to use the cell shown in (b), we must remember that only 1/8 of each corner atom belongs to this unit cell with the remaining 7/8 associated with surrounding unit cells. Similarly, edge centre atoms belong to four adjacent unit cells and, therefore, only 1/4 of each is counted. Finally, face centred atoms are split between two adjacent unit cells and therefore, each counts as half an atom. If we use diagram (c) to represent our unit cell contents, then all of the four atoms shown belong entirely to this unit cell and, for instance, other corner atoms are simply the corner atoms of adjacent unit cells. Diagram (c) shows the bare minimum that is necessary to illustrate the crystal structure whereas diagram (b) is more informative and gives a much clearer perspective of the structure in 3D.
In assigning fractional coordinates to the positions of atoms in a unit cell, it is customary to include in the cell those atoms whose coordinates lie between 0 and 0.999. Atoms with negative coordinates or with coordinates ≥1 then lie in adjacent unit cells. This is illustrated in Fig. 1.22(d), in which four unit cells are drawn. Let us consider the top right cell; its origin is given as the solid circle and positive directions of x , y and z are indicated by arrows. The diagram shows the coordinates of one pair of opposite, C‐face Centre positions in each of the four cells. Relative to the origin of our chosen cell, all the C-centre positions shown at the right‐hand side have x = ½ and those at the left have x = −½. All positions in the diagram have a positive y value of ½. The z values are in three sets, with values of 1, 0 and –1. In considering the contents of the top right cell, the position at ½½0 is regarded as belonging to the cell, but all other positions shown belong to neighbouring cells.
1.15 Materials that can be Described as Close Packed
1.15.1 Metals
Most metals crystallise in one of the three arrangements, ccp, hcp and bcc, the first two of which are cp structures. The distribution of structure type among the metals is irregular (Table 1.3), and no clear‐cut trends are observed. It is still not well understood why particular metals prefer one structure type to another. Calculations reveal that the lattice energies of hcp and ccp metal structures are comparable and, therefore, the structure observed in a particular case probably depends on fine details of the bonding requirements or band structures of the metal. Structural details of elements not included in Table 1.3 are given in Appendix D.
1.15.2 Alloys
Alloys are intermetallic phases or solid solutions and, as is the case for pure metals, many have cp structures. For example, Cu and Au have ccp structures, both as pure elements and when mixed to form Cu–Au alloys. At high temperatures, a complete range of solid solutions between Cu and Au forms. In these the Cu and Au atoms are distributed statistically over the lattice points of the fcc unit cell and therefore the ccp layers contain a random mixture of Cu and Au atoms. On annealing the compositions AuCu and AuCu 3at lower temperatures, the Au and Cu atoms order themselves; ccp layers still occur but the arrangement within the layers is no longer statistical. Such order–disorder phenomena occur commonly in both metallic and ionic structures.
Table 1.3 Structures, unit cell dimensions, and metallic radii of some common metals
| ccp | hcp | bcc | |||||||
|---|---|---|---|---|---|---|---|---|---|
| Metal | r /Å | a /Å | Metal | r /Å | a /Å | c /Å | Metal | r /Å | a /Å |
| Cu | 1.28 | 3.6147 | Be | 1.12 | 2.2856 | 3.5842 | Fe | 1.24 | 2.8664 |
| Ag | 1.45 | 4.0857 | Mg | 1.60 | 3.2094 | 5.2105 | Cr | 1.25 | 2.8846 |
| Au | 1.44 | 4.0783 | Zn | 1.37 | 2.6649 | 4.9468 | Mo | 1.36 | 3.1469 |
| Al | 1.43 | 4.0495 | Cd | 1.52 | 2.9788 | 5.6167 | W | 1.37 | 3.1650 |
| Ni | 1.24 | 3.5240 | Ti | 1.47 | 2.9506 | 4.6788 | Ta | 1.43 | 3.3026 |
| Pb | 1.75 | 4.9502 | Zr | 1.60 | 3.2312 | 5.1477 | Ba | 2.17 | 5.019 |
1.15.3 Ionic structures
Интервал:
Закладка:
Похожие книги на «Solid State Chemistry and its Applications»
Представляем Вашему вниманию похожие книги на «Solid State Chemistry and its Applications» списком для выбора. Мы отобрали схожую по названию и смыслу литературу в надежде предоставить читателям больше вариантов отыскать новые, интересные, ещё непрочитанные произведения.


Обсуждение, отзывы о книге «Solid State Chemistry and its Applications» и просто собственные мнения читателей. Оставьте ваши комментарии, напишите, что Вы думаете о произведении, его смысле или главных героях. Укажите что конкретно понравилось, а что нет, и почему Вы так считаете.