Magnetic Resonance Microscopy
Здесь есть возможность читать онлайн «Magnetic Resonance Microscopy» — ознакомительный отрывок электронной книги совершенно бесплатно, а после прочтения отрывка купить полную версию. В некоторых случаях можно слушать аудио, скачать через торрент в формате fb2 и присутствует краткое содержание. Жанр: unrecognised, на английском языке. Описание произведения, (предисловие) а так же отзывы посетителей доступны на портале библиотеки ЛибКат.
- Название:Magnetic Resonance Microscopy
- Автор:
- Жанр:
- Год:неизвестен
- ISBN:нет данных
- Рейтинг книги:4 / 5. Голосов: 1
-
Избранное:Добавить в избранное
- Отзывы:
-
Ваша оценка:
Magnetic Resonance Microscopy: краткое содержание, описание и аннотация
Предлагаем к чтению аннотацию, описание, краткое содержание или предисловие (зависит от того, что написал сам автор книги «Magnetic Resonance Microscopy»). Если вы не нашли необходимую информацию о книге — напишите в комментариях, мы постараемся отыскать её.
Explore the interdisciplinary applications of magnetic resonance microscopy in this one-of-a-kind resource Magnetic Resonance Microscopy: Instrumentation and Applications in Engineering, Life Science and Energy Research,
Magnetic Resonance Microscopy: Instrumentation and Applications in Engineering, Life Science and Energy Research
Magnetic Resonance Microscopy: Instrumentation and Applications in Engineering, Life Science and Energy Research
Magnetic Resonance Microscopy — читать онлайн ознакомительный отрывок
Ниже представлен текст книги, разбитый по страницам. Система сохранения места последней прочитанной страницы, позволяет с удобством читать онлайн бесплатно книгу «Magnetic Resonance Microscopy», без необходимости каждый раз заново искать на чём Вы остановились. Поставьте закладку, и сможете в любой момент перейти на страницу, на которой закончили чтение.
Интервал:
Закладка:
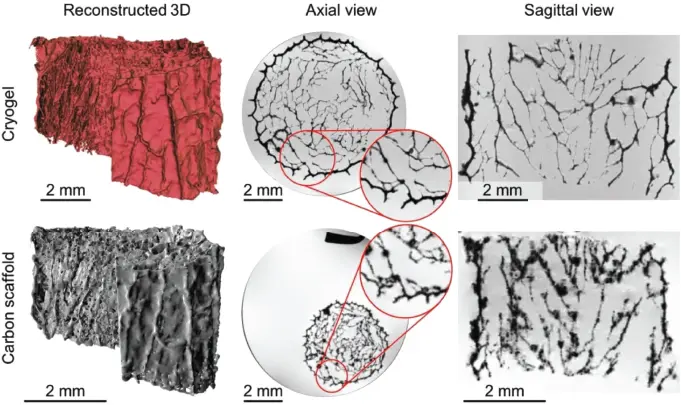
Figure 1.8 Porosity and connectivity analysis of a neuronal scaffold using magnetic resonance imaging microscopy, comparing a cryogel with its pyrolized and hence shrunk carbon counterpart. [37] Erwin Fuhrer et al. (2017), figure 02[p.03]/with permission from John Wiley & Sons, Inc.
Moreover, the low susceptibility to warping of the magnetic field caused by the carbon scaffold at 11.74 T opened the door for the exploration of carbon as a neuronal implant [38]. In this study, the authors produced carbon brain implant microelectrodes on Kapton foil, by lithographically structuring a photopolymer followed by pyrolysis and embedding in durimine before release. The implants were then investigated for their MR properties, including force-induced vibrations using a specially constructed dynamic force sensitive probe head [39]. Compared with platinum electrodes, which sufficiently warped the MRI signal coming from neighboring voxels, carbon electrodes permitted the acquisition of unwrapped images right up to the microelectrodes, thus paving the way for studies in postoperation tissue recovery and wound healing.
1.3.2 The Case of Epileptogenesis: Ex Situ Brain Slices and in Situ Histology
Brain-implanted microelectrodes target devastating diseases such as Parkinsons or epilepsy, and one of the primary questions in the field is whether it is possible to use noninvasive MRI to diagnose the disease, monitor recovery and temporal evolution of disease progress, and confirm correct system function of the implant. The hope is to translate diagnostic findings from mouse models to humans, despite certain differences, but with the benefit of using higher fields and hence higher-resolution techniques on model organisms than are generally available for humans. The gold standard for epileptogenesis is a kainate-initiated temporal lobe epilepsy mouse model established by Bouilleret et al. [40], for which a dedicated MR-compatible tissue slice environment was developed [35]. In this device, a freshly extracted brain slice 5 mm diameter, 500 µm thickness is maintained at physiological conditions (36°C, perfused, oxygenated) during MRI (Figure 1.7). Additional studies, which tracked the morphological changes of the brain slice over longer timeframes, were performed using a cryogenic vendor-supplied small animal coil [41], for the first time yielding confirmation of histological correlates with various MRI modalities. Using the same cryo-imaging coil, translation of these techniques to the full animal model yielded a comprehensive picture of the disease progression [42] and established a number of new measurement and postprocessing techniques, including high-resolution diffusion tensor imaging, see Figures 1.9 and 1.10.
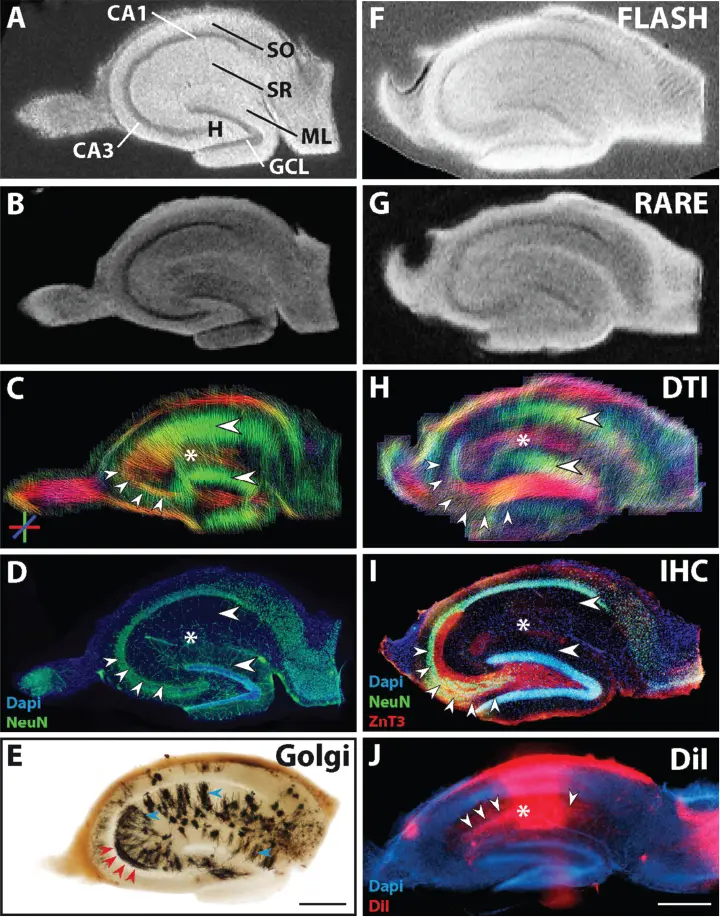
Figure 1.9 Magnetic resonance (MR) and histological images of fixed hippocampal sections of two control animals (Section 1: A–D, with an adjacent section used for Golgi staining: E; Section 2: F–I). (A, B, F, G) Structural magnetic resonance imaging (MRI) depicts the main neuronal cell layers and tissue architecture. Comparison of diffusion tractography images (C, H) to corresponding NeuN and ZnT3 immunostaining (D, I) shows that regions containing parallel extending dendrites of principal neurons evoke corresponding diffusion-weighted imaging (DWI) streamlines. (E) Golgi staining of an adjacent section depicts the localization and orientation of principal cell dendrites (blue arrowheads in SR and ML) and parts of mossy fibers in CA3 (red arrowheads). (J) DiI crystal placed into the CA1 stratum radiatum, showing the orientation of CA1 pyramidal cells as well as of innervating CA3 Schaffer collaterals (asterisk and arrowheads, respectively). Scale bar: 500 µm. [41] Katharina Göbel-Guéniot et al. (2020), figure 02[p.06]/Frontiers Media S.A./CC BY 4.0.
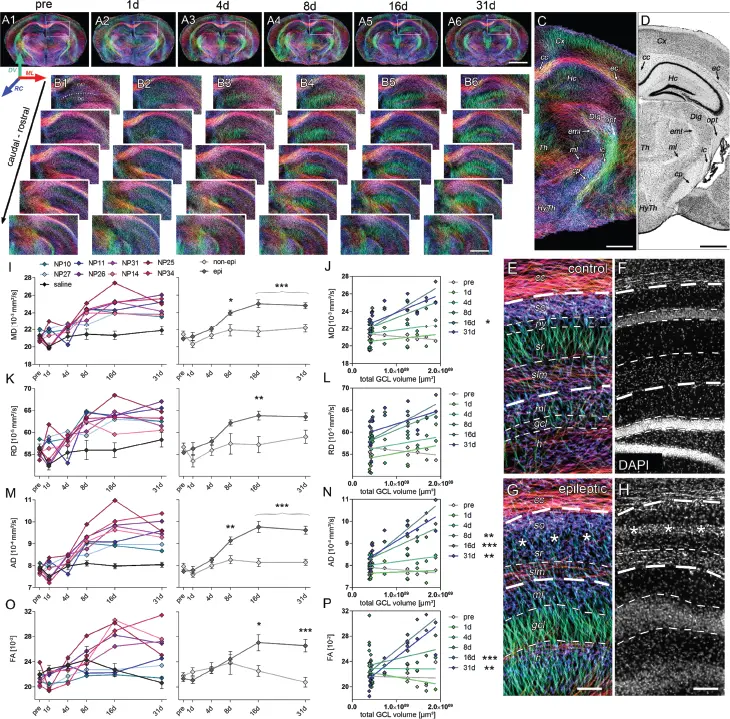
Figure 1.10 Microstructural reorganization quantified by diffusion-weighted imaging (DWI) during epileptogenesis predicts disease progression. (A1–6) Representative coronal sections from diffusion-weighted tractography at different time points during epileptogenesis (before injection = pre; 1 day, 4 days, 7 days, 14 days, and 31 days following SE). (B1–6) Enlarged images. (C–D) Representative tractography image and a Nissl-stained section of corresponding brain regions for anatomical comparison. Computed fibers relate to major axonal pathways and brain regions exhibiting highly oriented dendrites (cc, corpus callosum). (E, G) Enlarged tractography images demonstrating the distinct orientation of streamlines in different hippocampal layers. (F, H) Corresponding 4′,6-diamidino-2-phenylindole (DAPI)-stained sections. Scale bars in A, 2 mm; B–D, 500 mm; H (left), 100 mm (I, K, M, O). Quantitative analysis of DWI metrics in the dentate gyrus (DG), plotted for individual mice (left panel; controls, black, n = 5; kainate-injected animals color-coded) and for groups during epileptogenesis. [42] Philipp Janz et al. (2017), figure 05[p.10]/eLife Sciences Publications Ltd./CC BY 4.0.
1.4 Augmented MR Microscopy
In situations in which microscopy is desired of objects that themselves have small dimensions, then there is an MR sensitivity advantage when using micro detectors. The challenge of sample handling at these dimensions, often achieved by microfluidic systems, can be turned into a feature when one considers the library of lab-on-a-chip (LOC) technologies already available, offering additional degrees of freedom in terms of sample management and interaction. Integration of NMR and microfluidics has continued to advance, starting from the earliest microcoil reports [43,44] to recent efforts taking advantage of LOC principles to enable microfluidic-based perfusion [35,45–49], electrochemistry [50], and hyperpolarization [51–53]. As discussed extensively in this chapter, micro-NMR coupled with MR microscopy is established and continues to evolve, with one branch of this evolution now extending toward fully exploring the augmented micro-MR system to further enhance the applicability of MR microscopy.
1.4.1 Perfusion
Perfusion can be considered a subclass of flow-based methods. In the context of this discussion, the definition of perfusion is relaxed slightly to include the passage of a fluid through microfluidic systems for the purpose of transporting nutrients and waste. Therefore, such systems can be used to maintain biological samples under conditions conducive to normal behavior, enabling long-term measurements of the system under normal and stimulated situations. Systems may include cell populations/layers/clusters and may increase in complexity up to tissue slices, organ-on-a-chip, and small organisms. Long-term measurement of such systems while using MR-compatible technical systems enables spatially resolved, longitudinal monitoring of morphology as a function of interesting stresses.
Starting from spectroscopy, perfusion-enabled microfluidic devices for long-term monitoring of biological systems have been used to monitor metabolic flux. Kalfe et al. [49] monitored a single tumor spheroid with diameter 500 µm over 24 h to characterize the transition from oxidative to glycolytic metabolism. Given the small volumes, it is important to ensure that the metabolic activity is reflective of the actual biological system and not perturbed, for example, by a lack of oxygen in the culture medium. This issue has been directly addressed by Yilmaz and Utz [47], who used a gas permeable membrane in combination with a micro-stripline [46] to ensure adequate oxygen supply for in situ cell culture NMR spectroscopy. Using 3D printing to produce MR-compatible microfluidic systems Montinaro et al. [45], demonstrated spectroscopy of small organisms, achieving detection volumes of 100 pl and therefore substructure spectroscopy of Caenorhabditis elegans in their work.
Читать дальшеИнтервал:
Закладка:
Похожие книги на «Magnetic Resonance Microscopy»
Представляем Вашему вниманию похожие книги на «Magnetic Resonance Microscopy» списком для выбора. Мы отобрали схожую по названию и смыслу литературу в надежде предоставить читателям больше вариантов отыскать новые, интересные, ещё непрочитанные произведения.


Обсуждение, отзывы о книге «Magnetic Resonance Microscopy» и просто собственные мнения читателей. Оставьте ваши комментарии, напишите, что Вы думаете о произведении, его смысле или главных героях. Укажите что конкретно понравилось, а что нет, и почему Вы так считаете.