Enrico Zio - Reliability Analysis, Safety Assessment and Optimization
Здесь есть возможность читать онлайн «Enrico Zio - Reliability Analysis, Safety Assessment and Optimization» — ознакомительный отрывок электронной книги совершенно бесплатно, а после прочтения отрывка купить полную версию. В некоторых случаях можно слушать аудио, скачать через торрент в формате fb2 и присутствует краткое содержание. Жанр: unrecognised, на английском языке. Описание произведения, (предисловие) а так же отзывы посетителей доступны на портале библиотеки ЛибКат.

- Название:Reliability Analysis, Safety Assessment and Optimization
- Автор:
- Жанр:
- Год:неизвестен
- ISBN:нет данных
- Рейтинг книги:3 / 5. Голосов: 1
-
Избранное:Добавить в избранное
- Отзывы:
-
Ваша оценка:
Reliability Analysis, Safety Assessment and Optimization: краткое содержание, описание и аннотация
Предлагаем к чтению аннотацию, описание, краткое содержание или предисловие (зависит от того, что написал сам автор книги «Reliability Analysis, Safety Assessment and Optimization»). Если вы не нашли необходимую информацию о книге — напишите в комментариях, мы постараемся отыскать её.
Reliability Analysis, Safety Assessment and Optimization — читать онлайн ознакомительный отрывок
Ниже представлен текст книги, разбитый по страницам. Система сохранения места последней прочитанной страницы, позволяет с удобством читать онлайн бесплатно книгу «Reliability Analysis, Safety Assessment and Optimization», без необходимости каждый раз заново искать на чём Вы остановились. Поставьте закладку, и сможете в любой момент перейти на страницу, на которой закончили чтение.
Интервал:
Закладка:
1.3.2 Parallel System
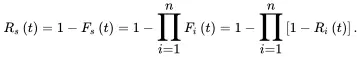
In a parallel system, the system functions or operates successfully when at least one component function is working. It implies that the failure of all components will cause the entire system to fail. The reliability block diagram of a parallel system is shown in Figure 1.9.
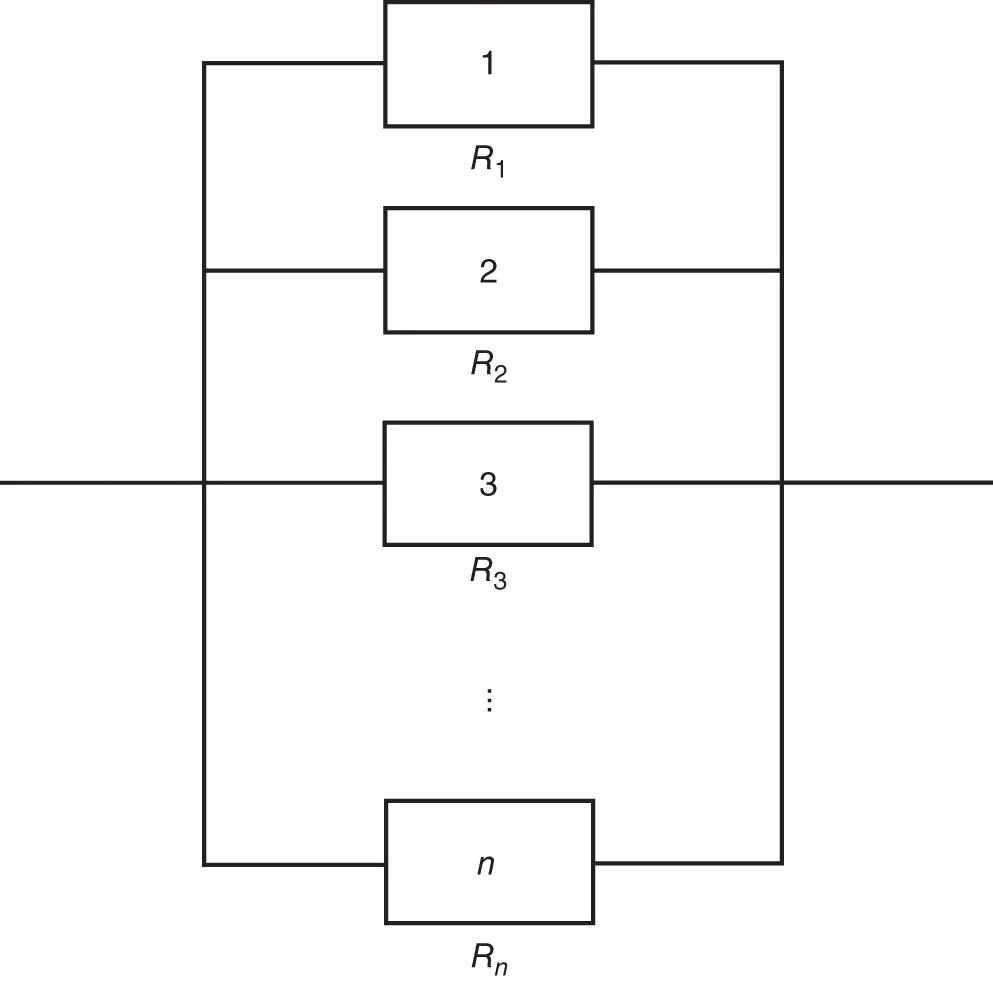
Figure 1.9 Reliability block diagram of a parallel system.
Denote Fs(t) as the probability of failure of the system. Denote Fi(t) as the probability of failure of component i. The system reliability can be expressed as
 (1.49)
It follows that
 (1.50)
1.3.3 Series-parallel System
A series-parallel system consists of m subsystems that are connected in series, with ni units connected in parallel in each subsystem, i=1,…,m. The reliability block diagram of a series-parallel system is shown in Figure 1.10.
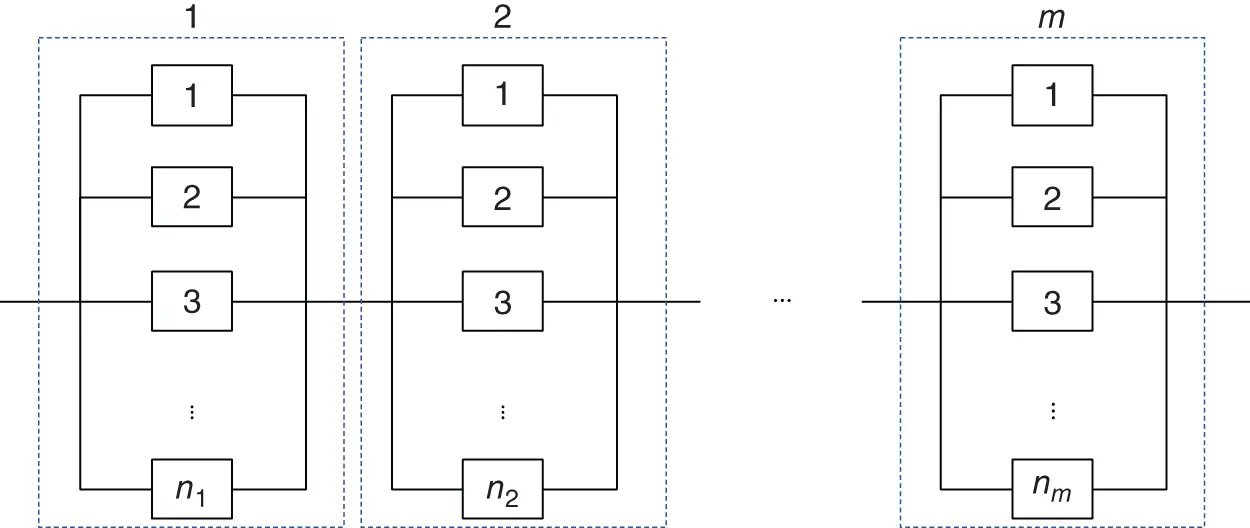
Figure 1.10 Reliability block diagram of a series-parallel system.
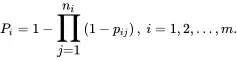
Denote pij as the reliability of component j in subsystem i, 1≤i≤m, 1≤j≤ni. Let Pi be the reliability of the subsystem i, 1≤i≤m. First, the reliability of each subsystem is derived as for the parallel system, that is,
 (1.51)
The reliability of the series-parallel system is, then,
 (1.52)
1.3.4 K-out-of-n System
For a system composed of n components, the system is operational if and only if at least k of the n components are operational. We call this type of system as k-out-of-n: G system, where G is short for Good. For a system composed of n components, the system fails if and only if at least k of the n components are failed. We call this type of system a k-out-of-n: F system. According to the definition, the series system is a 1-out-of-n: F system, where F is short for Failed. The parallel system is a 1-out-of-n: G system. We will mainly present the reliability of the k-out-of-n: G system here.
Assume that the n components are identical and independent. Denote R as the reliability of each component, F as the unreliability of each component, q=1−p. Let Pi be the probability so that exactly i components are functional. In a k-out-of-n: G system, the number of functional components follows the binomial distribution with parameter n and R. The probability that exactly i components are functional, Pi, is
 (1.53)
The reliability of the system is the probability that the number of functional components is greater than or equal to k. Thus, the system reliability, Rs, is calculated by
 (1.54)
If the components are not identical, the system reliability should be calculated by enumerating all combinations of working components.
1.3.5 Network System
There are systems that can be represented by network diagrams, for example, gas networks, telecommunications networks, and power networks. A network system consists of a set of nodes and links. All the nodes and links have a probability of failure.
1.4 System Reliability Assessment Methods
There are many reliability assessment approaches developed to compute the reliability of complex systems, e.g. networks. Path-set and cut-set methods, decomposition and factorization methods, and binary decision diagram (BDD) are four commonly used methods, and we will introduce them in this section.
1.4.1 Path-set and Cut-set Method
A path set P is a set of components, which by functioning ensures that the system is functioning. A path set is said to be minimal if it cannot be reduced without losing its status as a path set. A cut set K is a set of components, which by failing causes the system to fail. A cut set is said to be minimal if it cannot be reduced without losing its status as a cut set. We refer to these minimal sets as minimal path and cut sets or vectors (MPSs, MPVs and MCSs, MCVs).
Consider the minimal path sets of the system, P1, P2,…, Pp, and the minimal cut sets of the system, K1, K2,…, Kk. The reliability of the system is given by the union of all minimal path sets. The unreliability is given by the probability that at least one minimal cut set occurs.
Example 1.4
Consider a bridge structure with five edges, E1,…, E5, as shown in Figure 1.11:
1 Find the minimal path sets and the minimal cut sets of the system.
2 Calculate the reliability of the system if the reliability of each component is p.
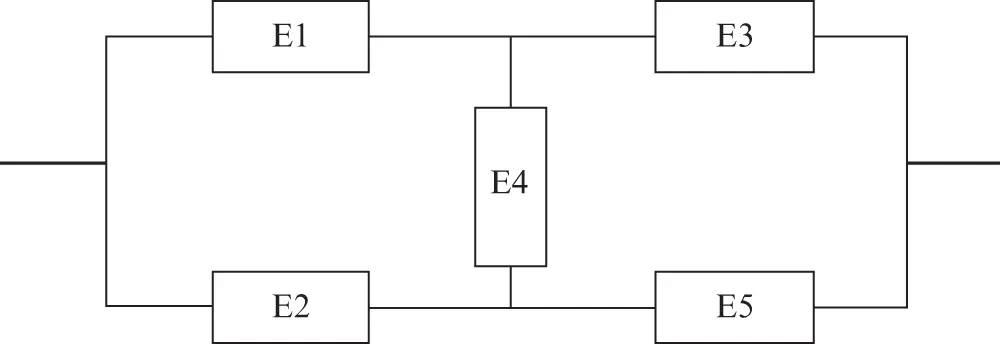
Figure 1.11 Bridge system.
Solution
1 The minimal path sets areThe minimal cut sets are
2 The reliability of the system is calculated by the union of the path sets:
1.4.2 Decomposition and Factorization
The decomposition method begins by selecting a critical component, denoted by x, which is an important component of the complex system structure. The reliability of the system can be calculated by the conditional probability:
 (1.55)
The factorization method is developed based on the decomposition method, which is used in a network system. Denote e as a critical edge in the network G. The reliability of the network is
 (1.56)
1.4.3 Binary Decision Diagram
Binary decision diagram (BDD) is used to represent a Boolean function. A Boolean function can be represented as a rooted, directed, acyclic graph, which consists of several nodes and two terminal nodes. The two terminal nodes are labeled 0 (FALSE) and 1 (TRUE). Each node u is labeled by a Boolean variable xi and has two child nodes called low child and high child. The edge from a node to a child represents an assignment of the value FALSE (or TRUE, respectively) to variable xi. The advantage of BDD in reliability assessment is that its accuracy and efficiency are high [6]. The algorithm to compute the probability of a gate from a BDD is based on the Shannon Decomposition, which is defined by recursive equations.
Читать дальшеИнтервал:
Закладка:
Похожие книги на «Reliability Analysis, Safety Assessment and Optimization»
Представляем Вашему вниманию похожие книги на «Reliability Analysis, Safety Assessment and Optimization» списком для выбора. Мы отобрали схожую по названию и смыслу литературу в надежде предоставить читателям больше вариантов отыскать новые, интересные, ещё непрочитанные произведения.


Обсуждение, отзывы о книге «Reliability Analysis, Safety Assessment and Optimization» и просто собственные мнения читателей. Оставьте ваши комментарии, напишите, что Вы думаете о произведении, его смысле или главных героях. Укажите что конкретно понравилось, а что нет, и почему Вы так считаете.