Doug Abbott - Embedded Linux development using Eclipse
Здесь есть возможность читать онлайн «Doug Abbott - Embedded Linux development using Eclipse» весь текст электронной книги совершенно бесплатно (целиком полную версию без сокращений). В некоторых случаях можно слушать аудио, скачать через торрент в формате fb2 и присутствует краткое содержание. Год выпуска: 2009, ISBN: 2009, Издательство: Elsevier, Жанр: Программирование, ОС и Сети, Программы, на английском языке. Описание произведения, (предисловие) а так же отзывы посетителей доступны на портале библиотеки ЛибКат.
- Название:Embedded Linux development using Eclipse
- Автор:
- Издательство:Elsevier
- Жанр:
- Год:2009
- ISBN:978-0-7506-8654-9
- Рейтинг книги:4 / 5. Голосов: 1
-
Избранное:Добавить в избранное
- Отзывы:
-
Ваша оценка:
Embedded Linux development using Eclipse: краткое содержание, описание и аннотация
Предлагаем к чтению аннотацию, описание, краткое содержание или предисловие (зависит от того, что написал сам автор книги «Embedded Linux development using Eclipse»). Если вы не нашли необходимую информацию о книге — напишите в комментариях, мы постараемся отыскать её.
• Overview of the latest C/C++ Development toolkit
• Includes case studies of eclipse use including Monta Vista, LynuxWorks, and WindRiver
Embedded Linux development using Eclipse — читать онлайн бесплатно полную книгу (весь текст) целиком
Ниже представлен текст книги, разбитый по страницам. Система сохранения места последней прочитанной страницы, позволяет с удобством читать онлайн бесплатно книгу «Embedded Linux development using Eclipse», без необходимости каждый раз заново искать на чём Вы остановились. Поставьте закладку, и сможете в любой момент перейти на страницу, на которой закончили чтение.
Интервал:
Закладка:
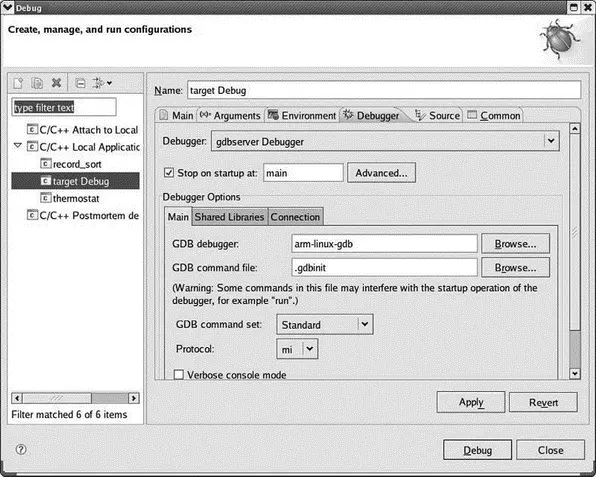
Figure 5.12: Target debug configuration.
Open the Debuggerdrop-down menu and select gdbserver Debugger. Enter the name of your cross gdb in the GDB debuggerfield. Click the Connectiontab under Debugger Options. Select TCPfrom the Typedrop-down and enter the IP address of your target in the Host name or IP addressfield (Figure 5.13). Click Applyand then Close. GDB is now configured to talk to your target board over the network.
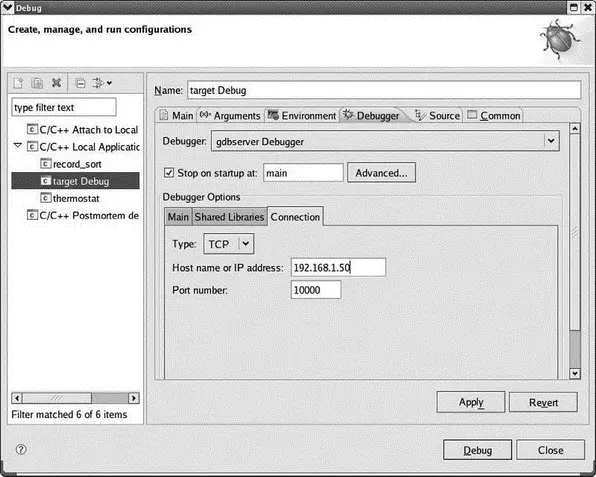
Figure 5.13: Target debug connection.
But before starting up a debug session, you have to start the application running on the target:
1. Execute minicomfrom a shell window on the host.
2. Power up your target board and boot into Linux.
3. In minicom, cd /homeand verify that it has the same contents as ~/workspaceon the host. If not, go back to the section on configuring networking and see if anything isn’t right. Try executing the mount command manually from the shell.
4. cd target/Debug.
5. Execute gdbserver :10000 target.
This last command starts gdbservertelling it to listen for a connection on TCP/IP port 10000, which is the default port assigned in the Eclipse configuration, and start up the targetexecutable. gdbserver responds that it created a process for the targetexecutable and that it is listening on port 10000. Note, incidentally, that you can use any port number you want as long as both sides use the same number and it doesn’t conflict with some other network service. Port numbers below 1024 are reserved for established services and shouldn’t be used.
Back in Eclipse, you should be in the C/C++ perspective. Select the target project in the Project Explorer view and execute Run→ Debug. Eclipse switches to the Debug perspective and you should see virtually the same thing you did earlier with the simulation version of the thermostat. On the target, gdbserverresponds that it has established a debugging session with host 192.168.1.2.
Play around with it to confirm that the target version really does behave like the simulation version. Note that program I/O is through the minicomwindow. When you’re finished terminate the debug session. gdbserverresponds that its child process, the target executable, has exited and then gdbserveritself exits.
Figure 5.14 attempts to put this whole process into graphical perspective. GDB itself is conceptually split into two major components that you can think of as the “front end” and the “back end.” The front end is effectively a client and provides the user interface. The back end is a server that controls and interacts with the program under test.
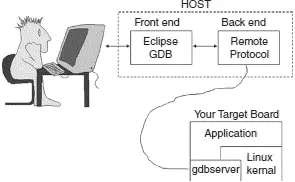
Figure 5.14: GDB architecture.
The back end is architecture-dependent so it knows how to do things like disassemble machine code and set breakpoints. When we debugged the simulation thermostat, the back end simply ran the program under test on the workstation.
Things got a little more complicated when we moved to debugging on a remote target board. Now the back end running on the host has to know that it’s not running the program under test locally, but rather becomes a client to gdbserver running the program under test on the target. GDB provides a well-defined protocol for this communication. The primary role of gdbserver is to get and set memory locations and processor registers, and to maintain control over execution of the program under test.
The existence of a well-defined and public protocol for communicating between the GDB back end and gdbserver opens other possibilities for communicating with the target. Specifically, vendors of In Circuit Emulators (ICE) and JTAG boxes can use that protocol to make their products useable from GDB and Eclipse.
Summary
This chapter has delved deeper into the Eclipse C Developers’ Toolkit (CDT) to look at issues such as supplying your own Makefiles, cross-compiling for target embedded hardware, and debugging an application on a remote target board. We also explored the notion of using high level simulation to get started with application software testing before any target hardware is available.
The next chapter looks at the Device Software Development Platform (DSDP), another Eclipse project related to embedded software development. In particular, DSDP provides target management capabilities that further simplify the process of connecting to a remote target.
CHAPTER 6
Device Software Development Platform
The Eclipse Device Software Development Platform (DSDP) extends CDT to address specific needs of embedded device software developers. It consists of six subprojects, some of which are farther along than others:
• Target Management (TM)
• Remote System Explorer (RSE)
• Native Application Builder (NAB)
• Embedded Rich Client Platform (eRCP)
• Mobile Tools for the Java Platform (MTJ)
• Tools for Mobile Linux (TmL)
In this chapter, we’ll take a closer look at Target Management and the Native Application Builder. The Embedded Rich Client Platform is tied in with plug-in development that we’ll explore in the next chapter. Mobile Tools for Java and Tools for Mobile Linux are currently in an “incubation” stage, making them a little difficult to describe accurately and thoroughly.
But before proceeding, we should look at how Eclipse manages updates and extensions.
6.1 Adding on to Eclipse
The beauty of Eclipse is that it can be easily extended through the plug-in mechanism. Currently, your Eclipse installation includes the base platform, CDT, the Rich Client Platform (RCP), and a CVS version control system client. For this chapter we’ll install some additional features.
There are a couple of different approaches to adding features to Eclipse. The simplest approach is to download a zip file of one or more plug-ins and just unzip it in your Eclipse directory. Oddly though, plug-ins don’t seem to carry any information about what other plug-ins or features they may depend on. Thus, you may install a plug-in only to find that it doesn’t work because it’s dependent on something else that isn’t installed and isn’t identified.
Eclipse has addressed this issue with the concept of a feature , which bundles together plug-ins that are logically related to perform some useful function. Features are then published to an update site on the Internet from where they can be downloaded by the Eclipse Update Manager. Organizations that create Eclipse plug-ins are encouraged to maintain an update site and publish their plug-ins as features.
Start up Eclipse if it’s not already running and select Help→Software Updatesto bring up the menu in Figure 6.1. The Available Software tab is displayed, listing update sites that can be searched for new features. You can add remote update sites in the form of URLs or Local sites, such as a CD. An Archive site is a local site packaged as jar or zip files.
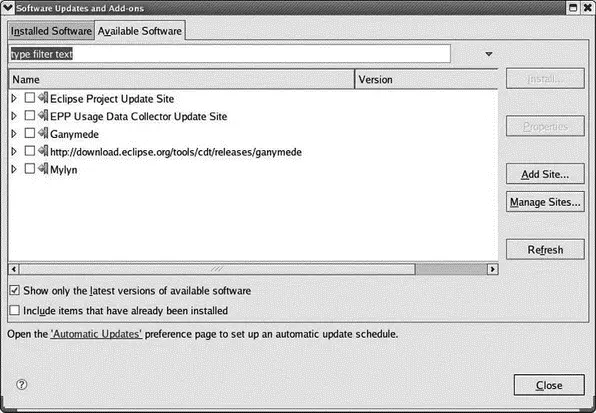
Figure 6.1: Update Manager.
Читать дальшеИнтервал:
Закладка:
Похожие книги на «Embedded Linux development using Eclipse»
Представляем Вашему вниманию похожие книги на «Embedded Linux development using Eclipse» списком для выбора. Мы отобрали схожую по названию и смыслу литературу в надежде предоставить читателям больше вариантов отыскать новые, интересные, ещё непрочитанные произведения.


Обсуждение, отзывы о книге «Embedded Linux development using Eclipse» и просто собственные мнения читателей. Оставьте ваши комментарии, напишите, что Вы думаете о произведении, его смысле или главных героях. Укажите что конкретно понравилось, а что нет, и почему Вы так считаете.