Doug Abbott - Embedded Linux development using Eclipse
Здесь есть возможность читать онлайн «Doug Abbott - Embedded Linux development using Eclipse» весь текст электронной книги совершенно бесплатно (целиком полную версию без сокращений). В некоторых случаях можно слушать аудио, скачать через торрент в формате fb2 и присутствует краткое содержание. Год выпуска: 2009, ISBN: 2009, Издательство: Elsevier, Жанр: Программирование, ОС и Сети, Программы, на английском языке. Описание произведения, (предисловие) а так же отзывы посетителей доступны на портале библиотеки ЛибКат.

- Название:Embedded Linux development using Eclipse
- Автор:
- Издательство:Elsevier
- Жанр:
- Год:2009
- ISBN:978-0-7506-8654-9
- Рейтинг книги:4 / 5. Голосов: 1
-
Избранное:Добавить в избранное
- Отзывы:
-
Ваша оценка:
Embedded Linux development using Eclipse: краткое содержание, описание и аннотация
Предлагаем к чтению аннотацию, описание, краткое содержание или предисловие (зависит от того, что написал сам автор книги «Embedded Linux development using Eclipse»). Если вы не нашли необходимую информацию о книге — напишите в комментариях, мы постараемся отыскать её.
• Overview of the latest C/C++ Development toolkit
• Includes case studies of eclipse use including Monta Vista, LynuxWorks, and WindRiver
Embedded Linux development using Eclipse — читать онлайн бесплатно полную книгу (весь текст) целиком
Ниже представлен текст книги, разбитый по страницам. Система сохранения места последней прочитанной страницы, позволяет с удобством читать онлайн бесплатно книгу «Embedded Linux development using Eclipse», без необходимости каждый раз заново искать на чём Вы остановились. Поставьте закладку, и сможете в любой момент перейти на страницу, на которой закончили чтение.
Интервал:
Закладка:
Have a look through the four source files to see how it all hangs together.
5.2.1 Running the Simulation
The devices program needs to be started first. We’ll run it from a shell window outside of Eclipse. In a shell window, cdto ~/workspace/thermostat(note that “~” is a shortcut for your home directory). Both executables, thermostat_sand devices, are in this directory. Enter ./devicesto start the devices program.
Back in Eclipse, right-click thermostat_sunder the thermostat project in the Project Explorer view and select Debug As→Debug Configurations…to create a new debug configuration for this project. Name it whatever you’d like and select the thermostat project. Search Projectdoesn’t work for finding an application in a Makefile project, so you have to browse to the project directory in your workspace and select the file, thermostat_s. If you choose, enter a number in the Arguments tab for the program’s loop delay time in seconds. Click Applyand then Debug.
As before, Eclipse brings up the Debug perspective with the program stopped at the first executable line of main().
5.3 Debugging Multi-Threaded Programs
The thermostat program uses POSIX threads (pthreads) to create two independent threads of execution: the thermostat state machine, and the monitor that looks for parameter changes. Fortunately, Eclipse and gdb are very good at handling multithreaded programs.
Set a breakpoint at the call to createThread()and resume the program. Step into createThread()and step until the pthread_create()function executes. The Debug view now shows that a second thread has been created (Figure 5.6). Thread [1] is suspended in createThread()as we expect.
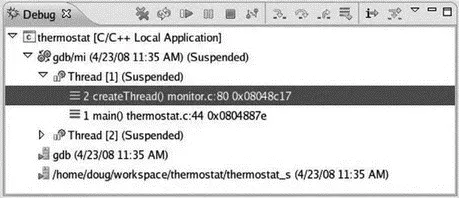
Figure 5.6: Multi-threaded debug.
Thread [2] is also suspended. Expand its entry in the Debug view and you’ll see that it is suspended in the clone()function. clone()is a Linux system service, that like fork(), creates a child process but offers finer control over what gets shared between parent and child. Thus it is useful for creating kernel-schedulable threads that share their parent process’s global data space.
At this point we would probably want to gain control of the monitor thread to watch its execution. monitor.cshould already be open in an Editor window since we’ve been stepping through a function in that file. Scroll back up to find the monitor()function that executes Thread [2]. How do we know that that’s the right function? Well, monitoris the start_routine argument to pthread_create().
Set a breakpoint on the line following the call to fgets(). fgets()doesn’t return until you enter a string on stdin. Click the Step Returnbutton to get back to main(). Expand Thread [2]’s entry in the Debug view and you’ll see that it’s now way down deep somewhere in the kernel having called fgets()from monitor().
At this point you might want to step through initDigIO()and initAD()just to see what they do. When you’re finished, click the Resumebutton to let the program execute. The Debug view shows that both threads are Running and sample data starts appearing in the Console view.
Enter a new A/D value in devices and watch it show up in the thermostat output. In the same Console view, enter a parameter command, say “s 44,” to change the setpoint. Note that the Console view must have the focus to type something into it. This causes both threads to suspend with Thread [2] at the breakpoint, as we would expect. Thread [1] is deep inside the kernel having called the sleep()system service. You can now step through the execution of monitor()as it parses the command you just entered.
The next thing we might want to do is trace the execution of Thread [1] as it executes a state change. thermostat.cshould still be open in an Editor window, so select that tab. Set a breakpoint on the switch (state)line. Now in the Breakpoints view, open the Properties page for the breakpoint you just created and set the Condition as “value setpoint + deadband.” Incidentally, you can simply copy and paste that expression from thermostat.crather than having to type it.
Let the program resume and enter a new A/D value that is in fact greater than the setpoint you just entered plus the default deadband of 1. The condition for our new breakpoint is satisfied, and so the program suspends. We can now step through and verify that a state transition occurs and the “cooler” gets turned on.
Resume the program, but note that the breakpoint will be triggered again on the next pass through the loop because the condition is still true. You might want to change the condition to observe the transition to the LIMIT state.
This then is the general strategy for debugging multi-threaded applications. Strategically place breakpoints in the threads of interest and watch them interact. But what if you guess wrong and none of your breakpoints are triggered, or the breakpoints aren’t triggered because the program isn’t behaving as you expect?
In this case the Suspendbutton lets you regain control of the program. Suspendsends a SIGINT signal to the currently selected thread to suspend the program. Chances are the thread is not executing your source code but is somewhere inside the kernel with no symbol information available. This brings up a new Editor window with the notation “No source available for “”” and a View Disassemblybutton.
You can click View Disassemblyto see the actual machine code being executed when the signal was received, but it’s probably not terribly enlightening. The most useful thing to do is select the stack frame for your thread function to show where it is executing. Set a breakpoint immediately after that line and you’ll regain control in your thread function.
5.3.1 The Signals View
The suspend functionality raises the interesting question of how gdb handles signals in general. Normally, the SIGINT signal is generated by typing Ctrl-C, which causes the receiving process to be terminated if it doesn’t handle the signal itself.
The thermostat program registers a signal handler for SIGINT to terminate the program gracefully. Among other things, in a multi-threaded environment, it’s important that threads terminate in the correct order. That’s what the function terminateThread()does.
But by default gdb intercepts the signal and uses it to suspend the program. Click Window→Show View→Signals. This displays the Signals view in the upper right tabbed window (Figure 5.7). This shows you the signals defined on the selected target and how the debugger handles each one.
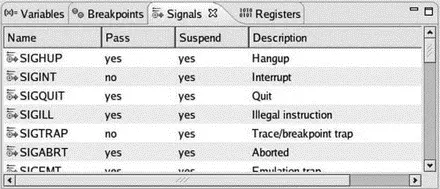
Figure 5.7: Signals view.
SIGINT is currently configured to suspend the program, which is the behavior we just saw, and not to pass the signal on to the program. Right-click the SIGINT entry and select Signal Properties. This brings up a dialog with two check boxes:
Читать дальшеИнтервал:
Закладка:
Похожие книги на «Embedded Linux development using Eclipse»
Представляем Вашему вниманию похожие книги на «Embedded Linux development using Eclipse» списком для выбора. Мы отобрали схожую по названию и смыслу литературу в надежде предоставить читателям больше вариантов отыскать новые, интересные, ещё непрочитанные произведения.


Обсуждение, отзывы о книге «Embedded Linux development using Eclipse» и просто собственные мнения читателей. Оставьте ваши комментарии, напишите, что Вы думаете о произведении, его смысле или главных героях. Укажите что конкретно понравилось, а что нет, и почему Вы так считаете.