Doug Abbott - Embedded Linux development using Eclipse
Здесь есть возможность читать онлайн «Doug Abbott - Embedded Linux development using Eclipse» весь текст электронной книги совершенно бесплатно (целиком полную версию без сокращений). В некоторых случаях можно слушать аудио, скачать через торрент в формате fb2 и присутствует краткое содержание. Год выпуска: 2009, ISBN: 2009, Издательство: Elsevier, Жанр: Программирование, ОС и Сети, Программы, на английском языке. Описание произведения, (предисловие) а так же отзывы посетителей доступны на портале библиотеки ЛибКат.
- Название:Embedded Linux development using Eclipse
- Автор:
- Издательство:Elsevier
- Жанр:
- Год:2009
- ISBN:978-0-7506-8654-9
- Рейтинг книги:4 / 5. Голосов: 1
-
Избранное:Добавить в избранное
- Отзывы:
-
Ваша оценка:
Embedded Linux development using Eclipse: краткое содержание, описание и аннотация
Предлагаем к чтению аннотацию, описание, краткое содержание или предисловие (зависит от того, что написал сам автор книги «Embedded Linux development using Eclipse»). Если вы не нашли необходимую информацию о книге — напишите в комментариях, мы постараемся отыскать её.
• Overview of the latest C/C++ Development toolkit
• Includes case studies of eclipse use including Monta Vista, LynuxWorks, and WindRiver
Embedded Linux development using Eclipse — читать онлайн бесплатно полную книгу (весь текст) целиком
Ниже представлен текст книги, разбитый по страницам. Система сохранения места последней прочитанной страницы, позволяет с удобством читать онлайн бесплатно книгу «Embedded Linux development using Eclipse», без необходимости каждый раз заново искать на чём Вы остановились. Поставьте закладку, и сможете в любой момент перейти на страницу, на которой закончили чтение.
Интервал:
Закладка:
• Show Full Paths: Toggles between showing the full path to the source files and just the file name. In practice, most of the time the path is just ../ anyway.
• View Management: The Debug view can automatically open and close views based on selection. This lets you select in which perspectives this feature should be enabled. Normally you would only want to enable this in the Debug perspective.
Click Step Overonce and then click Step Intoto get into the read_file()function. Note that a second stack frame appears in the Debug view and sort_utils.cis opened in the Editor. At this point it would be worth taking a closer look at the four tabbed views in the upper right of the workbench.
4.6.2 Variables View
When a stack frame is selected in the Debug view, the Variables view displays all the local variables in that frame. Figure 4.8 shows the Variables view for the read_file()stack frame. The two variables visible are both pointers. Clicking the white arrow to the left of the name de-references the pointer and displays the corresponding value. For string variables, the full string is displayed in the lower window.
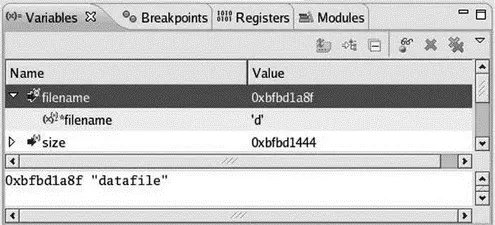
Figure 4.8: Variables view.
Select the main()stack frame in the Debug view and note that the Variables view changes to show the local variables in main(). If anything other than a stack frame is selected, the Variables view goes blank. Remember, you can also view the value of a variable simply by rolling the cursor over it.
4.6.3 Breakpoints View
To debug the problems in record_sort, you’ll probably want to set one or more breakpoints in the program and watch what happens. Select the Breakpoints view, which is currently empty because we haven’t set any breakpoints.
Let’s set a breakpoint at line 34 in sort_utils.c. That’s the beginning of an if statement in read_file(). Right-click in the marker bar at line 34 and select Toggle Breakpoint. A green circle appears to indicate that an enabled breakpoint is set at this location. The check mark indicates that the breakpoint was successfully installed. By the way, there’s an editor preference to display line numbers in the editor window.
Select Window→Preferences→General→Editors→Text Editors. The line number display can also be toggled from the marker bar context menu.
A new entry appears in the Breakpoints view with the full path to the breakpoint. The check box shows that the breakpoint is enabled. Click on the check box to disable the breakpoint and note that the circle in the marker bar changes to white. Disabled breakpoints are ignored by the debugger. Click the check box again to re-enable it.
Click Resumein the Debug view tool bar and the program proceeds to the breakpoint. The Thread [0] entry in the Debug view indicates that the thread is suspended because it hit a breakpoint. Click Step Overto load tempwith the first record. Select the Variables view and click the white arrow next to temp. Now you can see the current values of the fields in temp. Variables whose value has changed since the last time the thread was suspended are highlighted in yellow.
4.6.4 Breakpoint Properties
Breakpoints have some interesting properties that extend their flexibility and usefulness. Right-click on the entry in the Breakpoint view and select Propertiesto bring up the dialog in Figure 4.9.

Figure 4.9: Breakpoint properties—actions.
Actions can be attached to a breakpoint such that when it is hit, the attached actions are performed. CDT offers four classes of pre-defined actions:
• Play Sound: Play a selected sound file when the breakpoint is hit. Maybe the breakpoint only happens every half hour or so. You can go off and do something else and when you hear the appropriate beep, you can go back and see what happened. Sound files can be .wav, .mid, .au, or .aiff.
• Log Message: Output a message to the console.
• Run External Tool: Execute a program that has been configured in Eclipse as an external tool. For example, the program might be running on a remote device. You could configure the breakpoint to send an email or SMS to your desktop.
• Resume: Automatically resume the program after a specified delay. Again, if the program is running remotely, this is probably the only way to keep it running after a breakpoint.
From the Actionsdialog shown in Figure 4.9 you can create and edit actions using the four classes. Then you can attach one or more of these actions to the selected breakpoint. The actions are executed in the order that they appear in the Actions for this breakpoint list. Actions can be moved up and down in the list.
Try it out. Create a log action and a resume action and, if you’re so inclined, a sound action. Attach them to the breakpoint at line 34 and watch what happens. Be sure you click Applyafter setting up the action list.
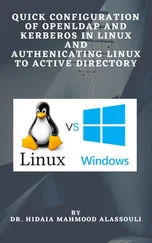
Personally, I think this feature probably could have been named a little better. The idea is that you can establish a Conditionfor triggering a breakpoint rather than have the breakpoint triggered every time it’s encountered. You can also specify, with the Ignore count, a number of times to ignore the breakpoint before triggering it. Figure 4.10 shows an example where the breakpoint will be triggered when the for loop variable “i” equals 9. The same behavior could be obtained by setting the Ignore count to 9.
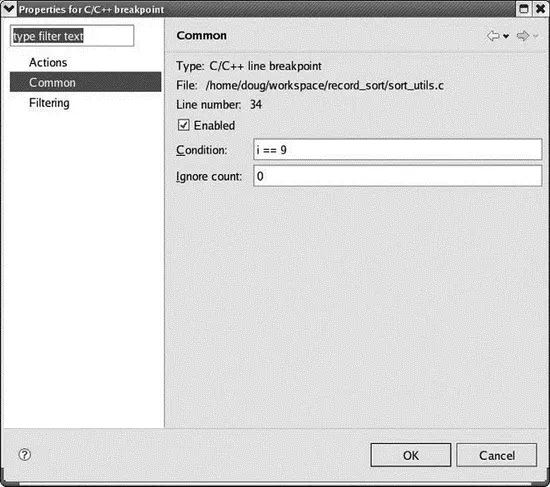
Figure 4.10: Breakpoint properties — Common.
Filtering lets you restrict a breakpoint to some subset of threads. Suppose, for example, you have several threads running the same code. You might set a breakpoint in the code, but you’re really only interested in stopping one particular thread. You can restrict the breakpoint to just that thread. We’ll look at multi-threaded debugging in the next chapter.
At this point it might be useful to let the program execute to line 42, nrecs+=10. Disable the breakpoint. Select line 42 in the Editor window and right-click for the context menu in the text area, not the marker bar. It’s worth noting that the context menus for the marker bar and text area are substantially different. Select Run to Line. The program executes to the selected line. This is simply an alternate form of execution control.
4.6.5 Other Views
There are two other views that are included in the upper right tab by default. They are the Registers and Modules views. The Registers view shows you the contents of the processor registers. This is only really useful if you’re debugging assembly language code. At “C-level” it doesn’t tell you much.
The Modules view shows what modules are loaded to create the complete program. Typically this consists of your own executable, plus some collection of shared libraries. Information provided for the executable includes a much more extensive version of the information found in the Outline view.
Читать дальшеИнтервал:
Закладка:
Похожие книги на «Embedded Linux development using Eclipse»
Представляем Вашему вниманию похожие книги на «Embedded Linux development using Eclipse» списком для выбора. Мы отобрали схожую по названию и смыслу литературу в надежде предоставить читателям больше вариантов отыскать новые, интересные, ещё непрочитанные произведения.


Обсуждение, отзывы о книге «Embedded Linux development using Eclipse» и просто собственные мнения читателей. Оставьте ваши комментарии, напишите, что Вы думаете о произведении, его смысле или главных героях. Укажите что конкретно понравилось, а что нет, и почему Вы так считаете.