Doug Abbott - Embedded Linux development using Eclipse
Здесь есть возможность читать онлайн «Doug Abbott - Embedded Linux development using Eclipse» весь текст электронной книги совершенно бесплатно (целиком полную версию без сокращений). В некоторых случаях можно слушать аудио, скачать через торрент в формате fb2 и присутствует краткое содержание. Год выпуска: 2009, ISBN: 2009, Издательство: Elsevier, Жанр: Программирование, ОС и Сети, Программы, на английском языке. Описание произведения, (предисловие) а так же отзывы посетителей доступны на портале библиотеки ЛибКат.
- Название:Embedded Linux development using Eclipse
- Автор:
- Издательство:Elsevier
- Жанр:
- Год:2009
- ISBN:978-0-7506-8654-9
- Рейтинг книги:4 / 5. Голосов: 1
-
Избранное:Добавить в избранное
- Отзывы:
-
Ваша оценка:
Embedded Linux development using Eclipse: краткое содержание, описание и аннотация
Предлагаем к чтению аннотацию, описание, краткое содержание или предисловие (зависит от того, что написал сам автор книги «Embedded Linux development using Eclipse»). Если вы не нашли необходимую информацию о книге — напишите в комментариях, мы постараемся отыскать её.
• Overview of the latest C/C++ Development toolkit
• Includes case studies of eclipse use including Monta Vista, LynuxWorks, and WindRiver
Embedded Linux development using Eclipse — читать онлайн бесплатно полную книгу (весь текст) целиком
Ниже представлен текст книги, разбитый по страницам. Система сохранения места последней прочитанной страницы, позволяет с удобством читать онлайн бесплатно книгу «Embedded Linux development using Eclipse», без необходимости каждый раз заново искать на чём Вы остановились. Поставьте закладку, и сможете в любой момент перейти на страницу, на которой закончили чтение.
Интервал:
Закладка:
In the Project Explorer view, select the top-level record_sortentry. Then execute Project→Build Projector right-click and select Build Configurations→Build All. In the former case, the Active Configuration will be built. By default this is the Debug configuration. The Active Configuration can be changed by executing Project→Build Configurations→Set Active.
In the latter case, both the Debug and Release configurations will be built. In either case one or two new entries will show up under record_sortin the Project Explorer view. These entries represent subdirectories called Debug/and Release/that hold, respectively, the object and executable files for the corresponding build configurations. Each also contains a makefile and some Eclipse-specific files.
Initially the build will fail because some compile-time errors and warnings have been built into sort_utils.c. Open the Problems view, expand the Errors entry, find the item that says “structure has no member named ‘Id’” and right-click on it. Select Go Toto open sort_utils.c, if it isn’t already open, and highlight the line that has the error (Figure 4.4). The correction should be fairly obvious.
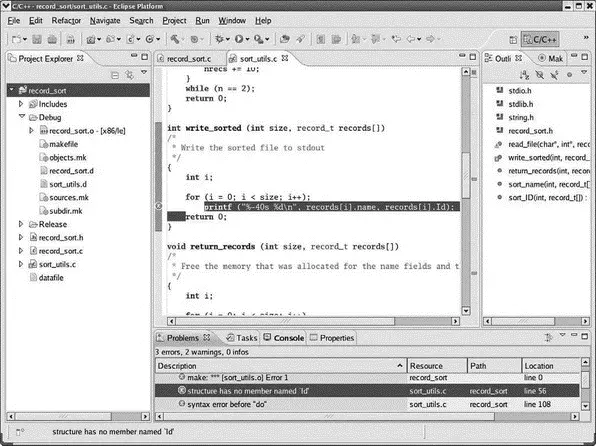
Figure 4.4: Identifying build problems.
Eclipse CDT identifies build problems several different ways. In the Project Explorer view, any project and source files that have problems are flagged with a red “×” icon for errors or a yellow shield icon with a “!” to indicate a warning. When a source file with errors or warnings is opened in the Editor, the tab shows the same symbol. The Outline view then uses the same icons to show which functions in the file have either errors or warnings.
The Editor window uses the same icons to identify the line on which each error or warning occurs. You can scroll through a source file and click on a line displaying either a warning or error icon and the Problems view will jump to the corresponding entry. If you roll the cursor over a line that’s identified as an error or warning, the corresponding error message pops up.
Correct the problems and build the project again. This time the build should succeed and you’ll see an executable file show up in the Debug tree in the Package Explorer view.
4.6 Debugging the Project
Execute Run→Debug. If you executed Build Configurations→Build→All, you’ll be asked to choose a local application to debug. Select the binary with the “bug” icon and click OK. Next you’re asked if you want to open the Debug perspective, shown in Figure 4.5. Yes, you do. This may also automatically create a debug launch configuration as discussed in the previous chapter. If not, the launch configuration dialog will pop up and you can create a new configuration named record_sort under C/C++ Local Application.
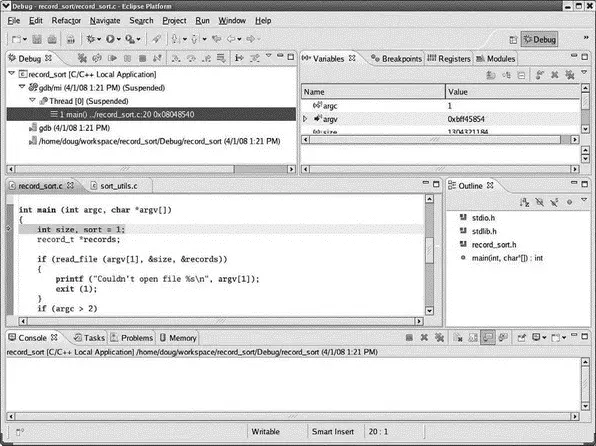
Figure 4.5: Debug perspective.
If the launch configuration dialog did not come up, execute Run→Debug Configurations…because we need to modify the configuration in any case. Select the Arguments tab as shown in Figure 4.6 and enter “datafile” into the Program arguments: window. datafileis a set of sample data records for the program to sort. It was imported into the project along with sort_utils.cand record_sort.h.
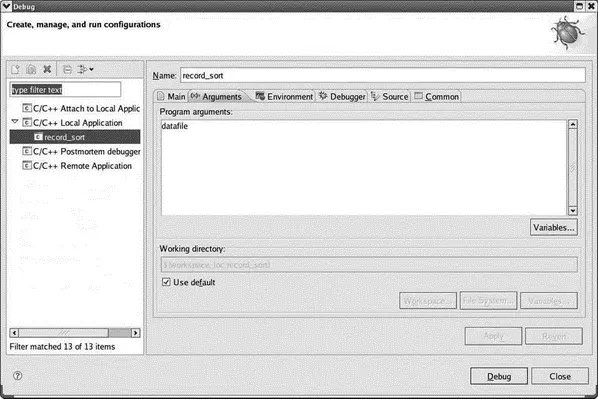
Figure 4.6: Debug launch configuration.
Note that the first line of main()is highlighted in the Editor window and a green arrow in the marker bar identifies this as the current execution point. That’s because, by default, Stop on startup at: main is selected in the launch configuration.
For now, go ahead and run the program by clicking the Resume icon in the Debug view toolbar. Hmmm, we didn’t get exactly the results we expected. datafile has twelve records, but only one record is output to the Console view. That’s because a couple of run-time errors have been built into the program to offer some practice using the debugger.
4.6.1 The Debug View
In the Debug view, right-click on the top level project entry and select Relaunchto start another debug run. The Debug view, shown in Figure 4.7, displays the state of the program in a hierarchical form. At the top of the hierarchy is a launch instance, that is, an instance of a launch configuration identified by its name. Below that is the debugger instance, identified by the name of the debugger, in this case, gdb. Beneath the debugger are the program threads under the debugger’s control. For record_sortthere is just one thread. In the next chapter we’ll see how gdb/Eclipse handles multithreaded programs.
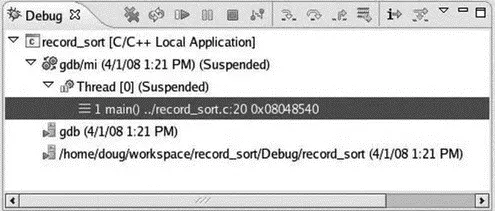
Figure 4.7: Debug view.
Finally, at the lowest level are the thread’s stack frames, identified by function name, source code line, and program counter. Currently there is only one stack frame for main(), stopped at record_sort.c, line 20.
The Debug view’s tool bar has lots of buttons for managing program execution as shown in Table 4.1.
Table 4.1: Debug Tool Bar Buttons
| Button | Name | Function |
|---|---|---|
 |
Remove all Terminated Launches | Clear all terminated processes in the Debug view. |
 |
Restart | Start a new debug session for the selected process. |
 |
Resume | Resume execution of the currently suspended debug target. |
 |
Suspend | Halt execution of the currently selected thread in the debug target. |
 |
Terminate | End the selected debug session and/or process. Behavior depends on the selected item’s type. |
 |
Disconnect | Detach the debugger from the selected process. |
 |
Step Into | If the execution point (program counter) is on a line that includes a function call, step into the function and stop at its first line. |
 |
Step Over | Step over any called functions in the current source line and stop at the next line in the current function. |
 |
Step Return | Execute to the end of the current function and stop at the next line of the caller. |
 |
Drop to Frame | Re-enter the selected stack frame. |
 |
Instruction Stepping Mode | Activate instruction stepping mode to follow execution one instruction at a time. |
 |
Use Step Filters | Activate step filters in the Debug view. |
The Debug view tool bar also has a menu with two items:
Читать дальшеИнтервал:
Закладка:
Похожие книги на «Embedded Linux development using Eclipse»
Представляем Вашему вниманию похожие книги на «Embedded Linux development using Eclipse» списком для выбора. Мы отобрали схожую по названию и смыслу литературу в надежде предоставить читателям больше вариантов отыскать новые, интересные, ещё непрочитанные произведения.


Обсуждение, отзывы о книге «Embedded Linux development using Eclipse» и просто собственные мнения читателей. Оставьте ваши комментарии, напишите, что Вы думаете о произведении, его смысле или главных героях. Укажите что конкретно понравилось, а что нет, и почему Вы так считаете.