Ibrahim Dogan - Advanced PIC Microcontroller Projects in C
Здесь есть возможность читать онлайн «Ibrahim Dogan - Advanced PIC Microcontroller Projects in C» весь текст электронной книги совершенно бесплатно (целиком полную версию без сокращений). В некоторых случаях можно слушать аудио, скачать через торрент в формате fb2 и присутствует краткое содержание. Город: Burlington, Год выпуска: 2008, ISBN: 2008, Издательство: Elsevier Ltd, Жанр: Программирование, Компьютерное железо, на английском языке. Описание произведения, (предисловие) а так же отзывы посетителей доступны на портале библиотеки ЛибКат.
- Название:Advanced PIC Microcontroller Projects in C
- Автор:
- Издательство:Elsevier Ltd
- Жанр:
- Год:2008
- Город:Burlington
- ISBN:978-0-7506-8611-2
- Рейтинг книги:5 / 5. Голосов: 1
-
Избранное:Добавить в избранное
- Отзывы:
-
Ваша оценка:
Advanced PIC Microcontroller Projects in C: краткое содержание, описание и аннотация
Предлагаем к чтению аннотацию, описание, краткое содержание или предисловие (зависит от того, что написал сам автор книги «Advanced PIC Microcontroller Projects in C»). Если вы не нашли необходимую информацию о книге — напишите в комментариях, мы постараемся отыскать её.
• Features 20 complete, tried and test projects
• Includes a CD-ROM of all the programs, hex listings, diagrams, and data sheets
Advanced PIC Microcontroller Projects in C — читать онлайн бесплатно полную книгу (весь текст) целиком
Ниже представлен текст книги, разбитый по страницам. Система сохранения места последней прочитанной страницы, позволяет с удобством читать онлайн бесплатно книгу «Advanced PIC Microcontroller Projects in C», без необходимости каждый раз заново искать на чём Вы остановились. Поставьте закладку, и сможете в любой момент перейти на страницу, на которой закончили чтение.
Интервал:
Закладка:
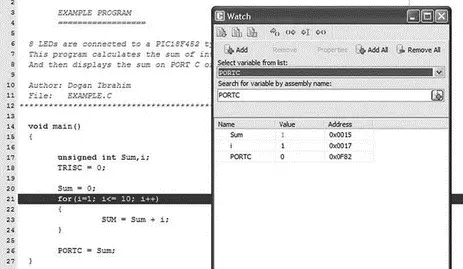
Figure 5.46: Single-stepping through the program
Step 6 Keep pressing F8 until the program comes out of the for loop and executes the line that sends data to PORTC. A this point, as shown in Figure 5.47, i = 11 and Sum = 55.
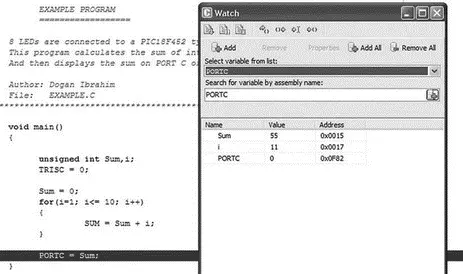
Figure 5.47: Single-stepping through the program
Step 7 Press F8 again to send the value of variable Sum to PORTC. As shown in Figure 5.48, in this case PORTC will have the decimal value 55, which is the sum of numbers from 1 to 10.
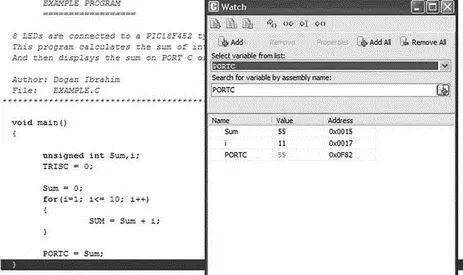
Figure 5.48: PORTC has the value 55
This is the end of the simulation. Select from drop-down menu Run→Stop Debugger .
In the above simulation example, we single-stepped through the program to the end and then we could see the final value of PORTC. The next example shows how to set breakpoints in the program and then execute up to a breakpoint.
Describe the steps involved in simulating the program developed in Example 5.1. Set a breakpoint at the end of the program and run the debugger up to this breakpoint. Display the values of various variables and PORTC at this point. What is the final value displayed on PORTC?
The steps are as follows:
Step 1 Start the mikroC IDE, making sure the program developed in Example 5.1 is displayed in the Code Editor window.
Step 2 From the drop-down menu select Debugger→Select Debugger→Software PIC Simulator .
Step 3 From the drop-down menu select Run→Start Debugger .
Step 4 Select variables Sum, i , and PORTC from the Watch window as described in Example 5.2.
Step 5 To set a breakpoint at the end of the program, click the mouse at the last closing bracket of the program, which is at line 27, and press F5. As shown in Figure 5.49, you should see a red line at the breakpoint and a little marker in the left column of the Code Editor window.
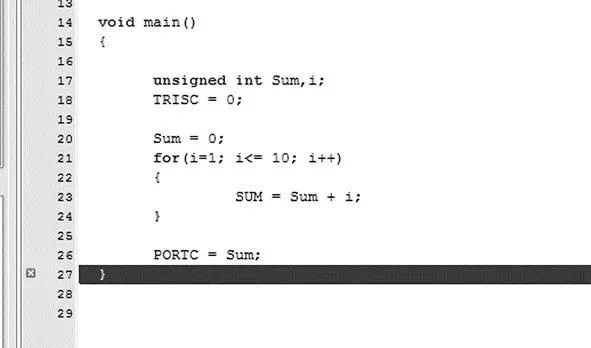
Figure 5.49: Setting a breakpoint at line 27
Step 6 Now, start the debugger, and press F6 key to run the program. The program will stop at the breakpoint, displaying variables as shown in Figure 5.48.
This is the end of the simulation. Select from drop-down menu Run→Stop Debugger .
To clear a breakpoint, move the cursor over the line where the breakpoint is and then press F5. To clear all breakpoints in a program, press the SHIFT+CTRL+F5 keys. To display the breakpoints in a program, press the SHIFT+F4 keys.
The following are some other useful debugger commands:
Step Into [F7] Executes the current instruction and then halts. If the instruction is a call to a routine, the program enters the routine and halts at the first instruction.
Step Over [F8] Executes the current instruction and then halts. If the instruction is a call to a routine, it skips it and halts at the first instruction following the call.
Step Out [CTRL+F8] Executes the current instruction and then halts. If the instruction is within a routine, it executes the instruction and halts at the first instruction following the call.
Run to Cursor [F4] Executes all instructions between the current instruction and the cursor position.
Jump to Interrupt [F2] Jumps to the interrupt service routine address (address 0x08 for PIC18 microcontrollers) and executes the procedure located at that address.
5.3.4 Using the mikroICD In-Circuit Debugger
This section discusses how to use the mikroICD in-circuit debugger (also called the PICFlash 2 programmer) to debug the program developed in Example 5.1. First of all, we have to build the hardware and then connect the in-circuit debugger device. In this example, the hardware is built on a breadboard, and a PICFlash 2 mikroICD in-circuit debugger is used to debug the system. Note that pins RB6 and RB7 are used by the mikroICD and are not available for I/O while mikroICD is active.
The project’s circuit diagram is shown in Figure 5.50. The mikroICD in-circuit debugger is connected to the development circuit using the following pins of the microcontroller:
• MCLR
• RB6
• RB7
• +5V
• GND
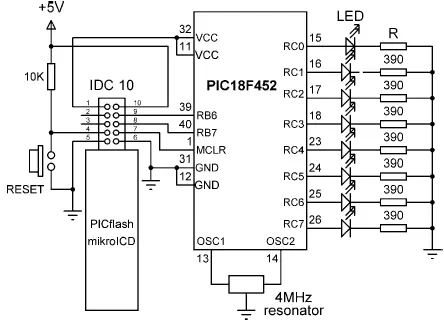
Figure 5.50: Circuit diagram of the project
The mikroICD has two modes of operation. In inactive mode all lines from the microcontroller used by the debugger device are connected to the development system. In active mode the MCLR, RB6, and RB7 pins are disconnected from the development system and used to program the microcontroller. After the programming, these lines are restored.
The mikroICD debugger device has a 10-way IDC connector and can be connected to the target system with a 10-way IDC header. Once the development is finished and the mikroICD debugger is removed, opposite pairs of the IDC header can be connected with jumpers. Figure 5.51 shows the system built on a breadboard.
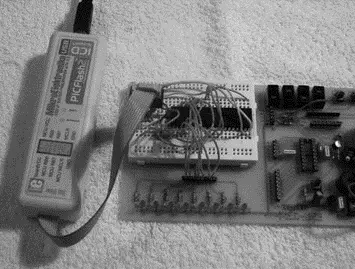
Figure 5.51: System built on a breadboard
After building the hardware we are ready to program the microcontroller and test the system’s operation with the in-circuit debugger. The steps are as follows:
Step 1 Start the mikroC IDE, making sure the program developed in Example 5.1 is displayed in the Code Editor window.
Step 2 Click the Edit Project button (Figure 5.52) and set DEBUG_ON as shown in Figure 5.53.
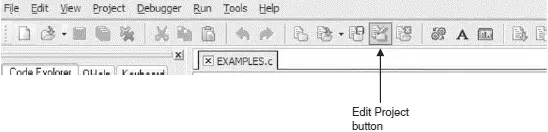
Figure 5.52: Edit Project button
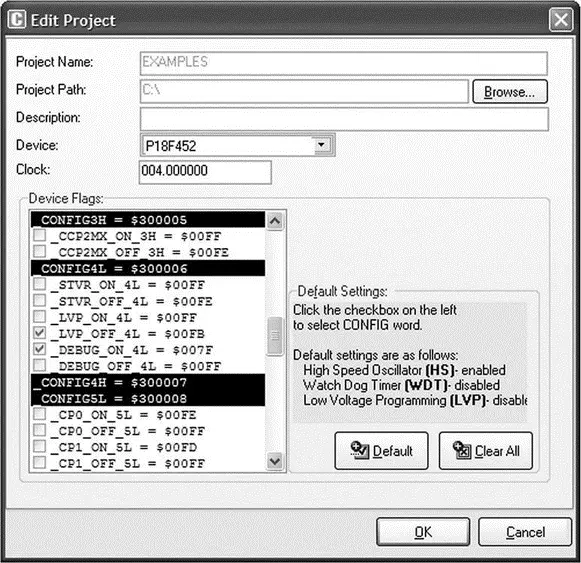
Figure 5.53: Set the DEBUG_ON
Step 3 Select ICD Debug in the Project Setup window as shown in Figure 5.54.
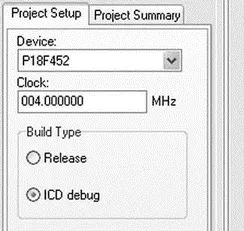
Figure 5.54: Select the ICD Debug
Step 4 Click the Build Project icon to compile the program with the debugger. After a successful compilation you should see the message Success (ICD Build) in the Message Window.
Step 5 Make sure the mikroICD debugger device is connected as in Figure 5.50, and select Tools→PicFlash Programmer from the drop-down menu to program the microcontroller.
Step 6 From the drop-down menu select Debugger→Select Debugger→mikroICD Debugger as shown in Figure 5.55.
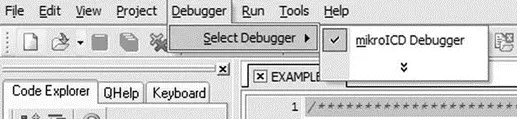
Figure 5.55: Selecting the mikroICD debugger
Читать дальшеИнтервал:
Закладка:
Похожие книги на «Advanced PIC Microcontroller Projects in C»
Представляем Вашему вниманию похожие книги на «Advanced PIC Microcontroller Projects in C» списком для выбора. Мы отобрали схожую по названию и смыслу литературу в надежде предоставить читателям больше вариантов отыскать новые, интересные, ещё непрочитанные произведения.


Обсуждение, отзывы о книге «Advanced PIC Microcontroller Projects in C» и просто собственные мнения читателей. Оставьте ваши комментарии, напишите, что Вы думаете о произведении, его смысле или главных героях. Укажите что конкретно понравилось, а что нет, и почему Вы так считаете.