Bruce Barnbaum - The Art of Photography - An Approach to Personal Expression
Здесь есть возможность читать онлайн «Bruce Barnbaum - The Art of Photography - An Approach to Personal Expression» весь текст электронной книги совершенно бесплатно (целиком полную версию без сокращений). В некоторых случаях можно слушать аудио, скачать через торрент в формате fb2 и присутствует краткое содержание. Жанр: Старинная литература, на английском языке. Описание произведения, (предисловие) а так же отзывы посетителей доступны на портале библиотеки ЛибКат.
- Название:The Art of Photography: An Approach to Personal Expression
- Автор:
- Жанр:
- Год:неизвестен
- ISBN:нет данных
- Рейтинг книги:5 / 5. Голосов: 1
-
Избранное:Добавить в избранное
- Отзывы:
-
Ваша оценка:
The Art of Photography: An Approach to Personal Expression: краткое содержание, описание и аннотация
Предлагаем к чтению аннотацию, описание, краткое содержание или предисловие (зависит от того, что написал сам автор книги «The Art of Photography: An Approach to Personal Expression»). Если вы не нашли необходимую информацию о книге — напишите в комментариях, мы постараемся отыскать её.
The Art of Photography: An Approach to Personal Expression — читать онлайн бесплатно полную книгу (весь текст) целиком
Ниже представлен текст книги, разбитый по страницам. Система сохранения места последней прочитанной страницы, позволяет с удобством читать онлайн бесплатно книгу «The Art of Photography: An Approach to Personal Expression», без необходимости каждый раз заново искать на чём Вы остановились. Поставьте закладку, и сможете в любой момент перейти на страницу, на которой закончили чтение.
Интервал:
Закладка:
But how do you identify true Zone 5 density? Let’s go back to the beginning of Chapter 8 where we defined standard exposure. Once you find the standard exposure, place the Zone 5 negative in the enlarger (at the same height and aperture you used to determine the standard exposure) and give it that same exposure. If it’s true Zone 5 density, the print you get will be exactly the same tone as the 18 percent gray card. When you develop the Zone 5 negative for the appropriate amount of time to achieve that density, you have found the normal development time″. (This fills in the temporary gap in the explanation of the zone system at the beginning of Chapter 8. It may be worthwhile to reread those pages now.)
Each higher zone grows progressively denser with increased development time. The portion of the negative exposed at Zone 6 (one stop brighter than the gray meter reading) achieves Zone 6 density in the normal development time, but it can exceed Zone 8 density with greatly extended development time. Increasing the development time beyond normal not only shifts the density of each zone equally, but also expands each zone in proportion to its original placement.
If development is terminated before the normal development time, precisely the opposite effect occurs. In that case, the density of each zone decreases in proportion to the original exposure on the zone scale. The higher zones are reduced in density more than the lower zones. Zone 1 is fixed in density no matter what development the negative is given. Those areas exposed as Zone 2 will not quite reach full Zone 2 density in less than normal development time. Zone 3, however, will begin to show significant changes, perhaps dropping to Zone 2  or 2¾. Areas exposed as Zone 4 may only reach Zone 3½ if development time is cut short. Zone 5, the gray meter’s average reading, may just exceed Zone 4, and Zone 6 may be just shy of Zone 5.
As you progress up the tonal scale to higher exposed densities, each is developed to a higher density than its predecessor, but each is reduced below normal density by a greater amount than its predecessor. Zone 9 may drop to Zone 7, while Zone 11 may barely exceed Zone 8 with a shortened development time.
Note
Increasing the development time beyond normal does not simply shift the density of each zone equally, but expands each in proportion to its original placement .
The Bellows Analogy
A simple way to grasp the concept of progressively increased densities with extended development times, and progressively reduced densities with shortened development times, is to think of each successive zone as a number on the successive pleats of a camera bellows. When development begins, the bellows are crunched down completely and each zone placement has zero density. As development progresses, the bellows are slowly extended to the right from the fixed point on the left so that the pleats, or zones, separate from one another—meaning that they separate in density. The longer the development time, the further the bellows are extended to the right, and the greater the density of the higher zones up to maximum negative density (Figure 9-2).
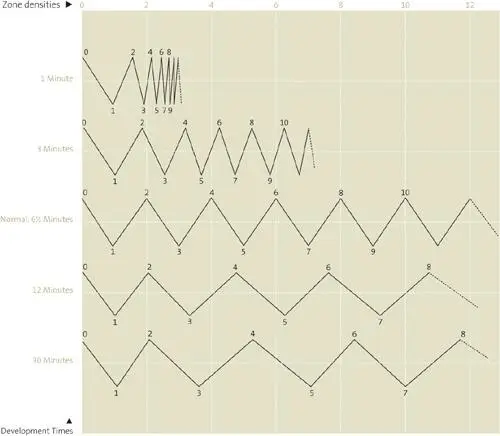
Negative density and print tonal scale Please note that Figure 9-2 is not a model of actual negative densities during development, but rather a schematic of what happens to densities as development proceeds. I will refer to it in the following examples to be consistent within the text, but don’t expect your combination of negative and developer to yield the same results as those shown here. Yours should be close, but not exact. (See Time/Temperature Development Charts for several films in Figure 9-6–Table 9-4.)
Figure 9-2. Density Increase During Development Time—The Barnbaum Bellows Analogy
Within the first minute of development, the zones begin to separate. At four minutes, Zone 1 is fully developed and Zone 2 is near its normal density, while the higher zones are noticeably falling short. If you choose 6½ minutes as the normal development time (my development time for Ilford HP5+ or Kodak Tri-X film in Kodak HC110 developer), you will see that the zone placements—the sensitization levels of the latent image, which are the numbers on the pleats—correspond to the developed densities. Beyond 6½ minutes, all zones except 0 and 1 continue to grow ever denser.
For example, note in the schematic representation at three minutes development time, the exposed Zone 4 reaches just above Zone 3 (a loss of nearly a full zone from its normal development density) whereas Zone 10 reaches only a bit above Zone 6, which is a loss of nearly 4 zones from normal. This shows that the higher zones lose more density than the lower zones with reduced development times. Contrast is decreased when development times are reduced below normal .
Conversely, with 12 minutes of development the exposed Zone 4 reaches 4 density (a gain of zone), whereas the exposed Zone 8 reaches almost Zone 11 (a gain of nearly 3 zones), and the exposed Zone 10 (beyond the chart) may go beyond Zone 14 (a gain of 4 zones). This shows that the higher zones gain more density than the lower zones with increased development times. Contrast is increased when development times extend beyond normal .
Another way of representing the development characteristics of the negative is via a graph (Figure 9-3), where the X-axis (the horizontal axis) represents development time in minutes and the Y-axis (the vertical axis) represents density. Each curved line represents the increase in density of an exposed zone as development proceeds. All exposed zones start the development process with no density, and density increases in proportion to the initial sensitization. At my normal development time of 6½ minutes, each exposed zone reaches its proper density. Beyond 6½ minutes, density continues to slowly increase (except for Zone 1) in proportion to the initial sensitization.
For those who have trouble understanding graphs, a brief explanation may help. Choose any one of the curved lines, such as the dark line which represents Zone 5. It begins at the lower left, like all the other lines, because it has no density at the start of development (0 minutes). As you move to the right, which represents elapsed development time, the curve rises, representing increased density. When you stop at any point along the curve, the distance from the Y-axis (the left edge) represents elapsed development time, while the height above the X-axis (the bottom) represents density. In three minutes, for example, negative density barely surpasses Zone 3. In 6½ minutes (shown as normal development time in this graph), it exactly reaches Zone 5 density. In 12 minutes, it exceeds Zone 6 density. Follow any other line to see how development proceeds with time.
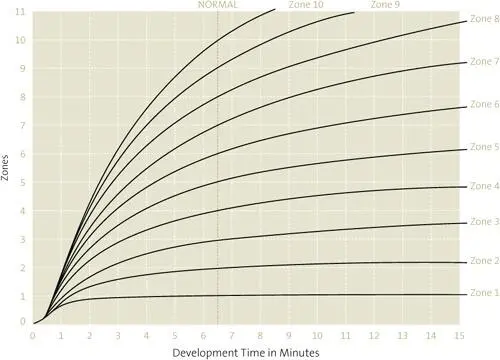
Figure 9-3, like the bellows schematic, is meant to be a visual aid to the understanding of the development process, but is not meant as an exact model of any specific negative material .
Figure 9-3. Zone-by-Zone Negative Development Curves
Note
During exposure the spread of zones between two objects never changes, but it can be altered during negative development .
Читать дальшеИнтервал:
Закладка:
Похожие книги на «The Art of Photography: An Approach to Personal Expression»
Представляем Вашему вниманию похожие книги на «The Art of Photography: An Approach to Personal Expression» списком для выбора. Мы отобрали схожую по названию и смыслу литературу в надежде предоставить читателям больше вариантов отыскать новые, интересные, ещё непрочитанные произведения.


Обсуждение, отзывы о книге «The Art of Photography: An Approach to Personal Expression» и просто собственные мнения читателей. Оставьте ваши комментарии, напишите, что Вы думаете о произведении, его смысле или главных героях. Укажите что конкретно понравилось, а что нет, и почему Вы так считаете.