Brenda A. Wilson - Bacterial Pathogenesis
Здесь есть возможность читать онлайн «Brenda A. Wilson - Bacterial Pathogenesis» — ознакомительный отрывок электронной книги совершенно бесплатно, а после прочтения отрывка купить полную версию. В некоторых случаях можно слушать аудио, скачать через торрент в формате fb2 и присутствует краткое содержание. Жанр: unrecognised, на английском языке. Описание произведения, (предисловие) а так же отзывы посетителей доступны на портале библиотеки ЛибКат.

- Название:Bacterial Pathogenesis
- Автор:
- Жанр:
- Год:неизвестен
- ISBN:нет данных
- Рейтинг книги:5 / 5. Голосов: 1
-
Избранное:Добавить в избранное
- Отзывы:
-
Ваша оценка:
Bacterial Pathogenesis: краткое содержание, описание и аннотация
Предлагаем к чтению аннотацию, описание, краткое содержание или предисловие (зависит от того, что написал сам автор книги «Bacterial Pathogenesis»). Если вы не нашли необходимую информацию о книге — напишите в комментариях, мы постараемся отыскать её.
Completely revised and updated, and for the first time in stunning full-color, Bacterial Pathogenesis: A Molecular Approach, Fourth Edition, builds on the core principles and foundations of its predecessors while expanding into new concepts, key findings, and cutting-edge research, including new developments in the areas of the microbiome and CRISPR as well as the growing challenges of antimicrobial resistance. All-new detailed illustrations help students clearly understand important concepts and mechanisms of the complex interplay between bacterial pathogens and their hosts. Study questions at the end of each chapter challenge students to delve more deeply into the topics covered, and hone their skills in reading, interpreting, and analyzing data, as well as devising their own experiments. A detailed glossary defines and expands on key terms highlighted throughout the book. Written for advanced undergraduate, graduate, and professional students in microbiology, bacteriology, and pathogenesis, this text is a must-have for anyone looking for a greater understanding of virulence mechanisms across the breadth of bacterial pathogens.
Bacterial Pathogenesis — читать онлайн ознакомительный отрывок
Ниже представлен текст книги, разбитый по страницам. Система сохранения места последней прочитанной страницы, позволяет с удобством читать онлайн бесплатно книгу «Bacterial Pathogenesis», без необходимости каждый раз заново искать на чём Вы остановились. Поставьте закладку, и сможете в любой момент перейти на страницу, на которой закончили чтение.
Интервал:
Закладка:
The 16S rRNA gene analysis of the baboon microbiota yielded a totally unexpected finding: the microbiota of the baboon vaginal tract was quite different from that of the human vaginal tract. Whereas Lactobacillus species dominate the human vaginal tract with minor components of other bacteria, species of Gram-positive bacteria (Firmicutes) other than Lactobacillus dominated the microbiota of the baboon vagina: mostly Clostridia, but also Gram-negative Fusobacteria and members of the phylum Bacteroidetes. This difference is illustrated in the clustering analysis shown in Figure 5-4. The difference between the composition of the human and baboon microbiota is striking, particularly in view of the fact that baboons seem to be so closely related to humans. Most of the bacterial species found in the baboon vaginal tract have representatives related to those isolated from humans, but largely those isolated from the human mouth and colon rather than the vaginal tract. Even within these groups, however, the human sequences clustered independently from the baboon sequences, indicating that, in many cases, the baboon sequences were not closely related to the human sequences and might represent new genera.
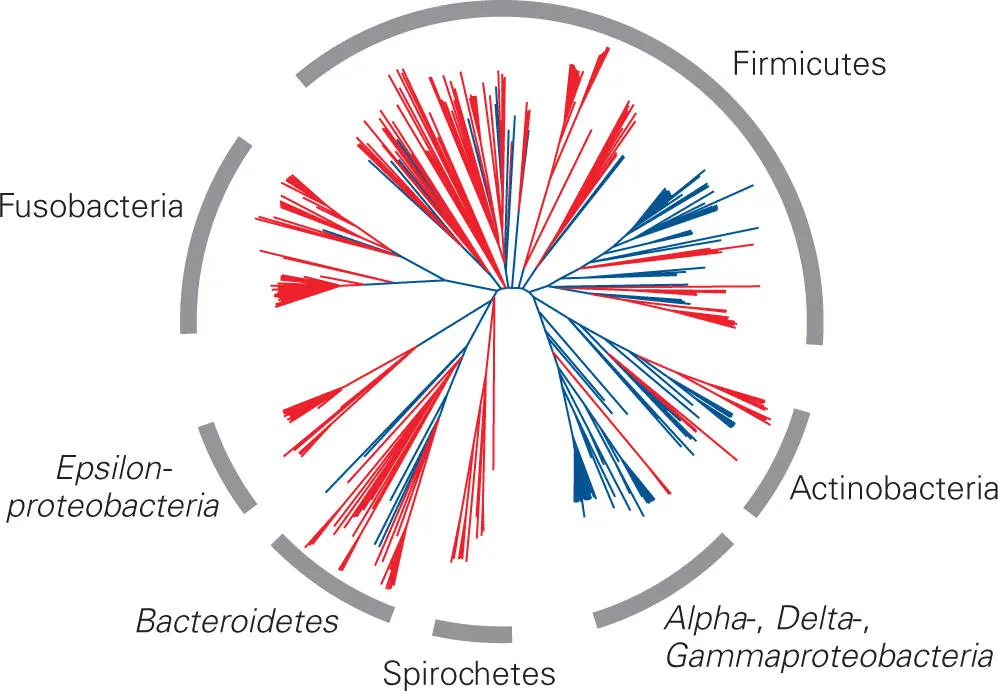
Figure 5-4. A radial phylogenetic tree showing the 16S rRNA gene sequence profiles of human and baboon vaginal microbes clustering to six major taxonomic groups. This radial tree shows relationships based on near-complete 16S rRNA gene sequences from the vaginal microbial community of captive baboons (red) and published human sequences (blue). Results show that the vaginal microbiota were clustered to six major taxonomic groups. Although Gram-positive bacteria dominate the vaginal microbiota of baboons, as they do in humans, there are major differences between the vaginal microbiotas of humans and baboons. Unlike humans, Lactobacillus species did not dominate the baboon microbiota. Even within the same taxa of bacteria, the baboon sequences clustered separately from the human sequences. Reprinted from Rivera AJ, Frank JA, Stumpf R, Salyers AA, Wilson BA, Olsen GJ, Leigh S. 2011. Am J Primatol 73:119–129, with permission.
One question that immediately comes to mind considering these results is if the vaginal microbiotas of other nonhuman primates besides baboons are also different from that of humans. Indeed, a comparative 16S rRNA gene-based analysis of vaginal bacteria clearly demonstrated host species-specific vaginal microbial communities among humans and nonhuman primates (see Figure 5-3). Humans were distinct from other primates not only in microbial composition and diversity, but also because only humans possessed Lactobacillus-dominant vaginal microbiota. The reason for this interesting difference is still under investigation.
While phylogenetic relationship analysis based on 16S rRNA gene sequences has some clear advantages and can provide valuable insights regarding the microbiota composition, there are important limitations. In practice, given the complexity and diversity of the populations found in most parts of the body, a 16S rRNA gene analysis provides at best a representation of the most abundant genera and species in a particular site. This information, nevertheless, is extremely valuable because it narrows down the possible groups of bacteria in the population and can guide cultivation efforts. For example, the possible presence of anaerobic bacteria such as Prevotella species means that anaerobic conditions should be included in any attempt to cultivate members of the dominant groups.
A more serious limitation of this approach is that the data from a 16S rRNA gene analysis are only semi-quantitative. Part of the problem is that endpoint PCR (see Figure 5-1B) is not strictly quantitative. This is due to the fact that some sequences seem to be amplified more efficiently than others (often referred to as PCR bias). Experience has shown that even some major members of the population may be misrepresented due to the absence of a strict quantitative representation of the microbiota. Nonetheless, the analysis gives an idea of what the leading members of the population are and provides a general assessment of their relative abundance.
Quantitative real-time PCR (qPCR). Once the members of a microbial community have been identified, the relative representation or abundance of those bacterial species can be determined by another method, called quantitative real-time PCR (qPCR). In one common variation of qPCR ( Figure 5-5), genomic DNA from the microbial community is prepared and used directly as the template in PCR amplification reactions containing primer pairs that anneal specifically to the 16S rRNA genes of the bacterial species of interest in the population. The course of the PCR reaction is followed by an increase in fluorescence caused by intercalation of a dye, such as SYBR green, into the double-stranded PCR products. Alternatively, sequence-specific DNA probes labeled with the fluorescent dye at one end and a fluorescence quencher moiety at the other end can be used to detect the DNA of interest after hybridization of the labeled probe with its complementary sequence. The quencher is removed by the 5′ to 3′ exonuclease activity of the thermostable DNA polymerase, which allows for detection of fluorescence from the probe bound to its complementary DNA. Newer probe designs allow for enhanced specificity and sensitivity of detection, and when coupled with different fluorescent labels enable simultaneous detection of multiple target DNAs (multiplexing).
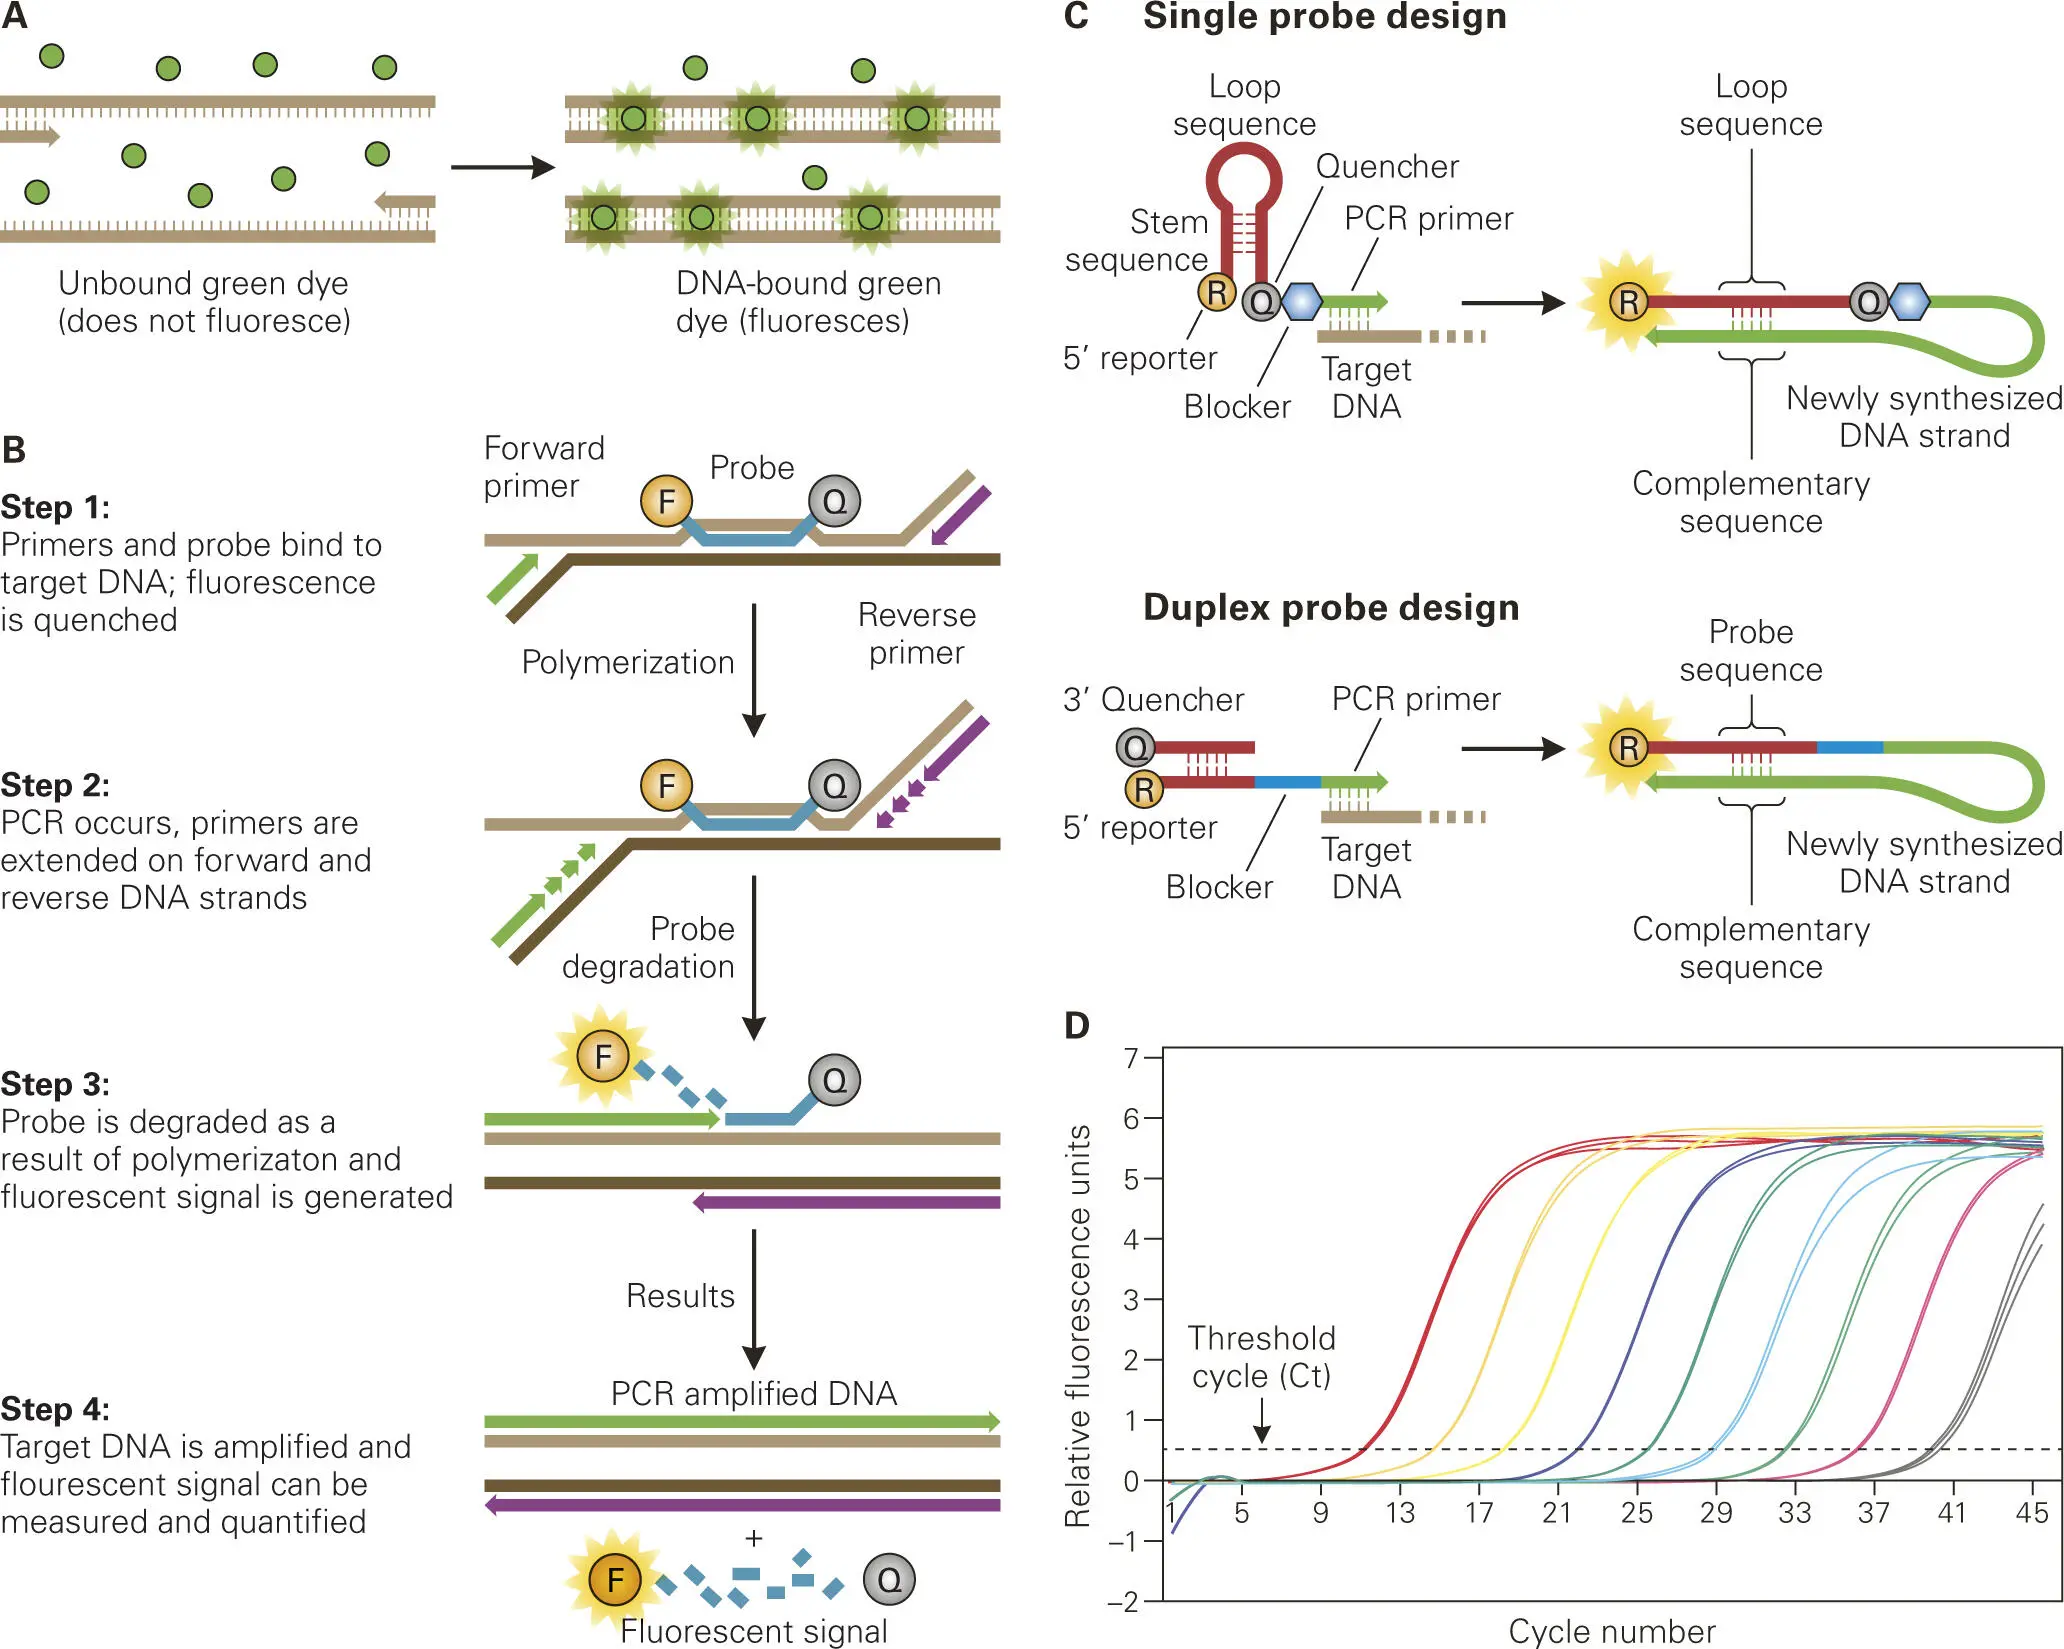
Figure 5-5. qPCR used to quantify specific bacteria in complex samples. Unlike conventional PCR, quantitative real-time PCR (qPCR) allows for detection of the target DNA in real time during the amplification process by measuring the fluorescence intensity above a given threshold. (A) Unbound fluorescent dye (typically SYBR green) does not fluoresce in the presence of ssDNA template, but does fluoresce when bound to newly formed dsDNA during the amplification process. (B) To eliminate fluorescence due to nonspecific binding of fluorescent dye, fluorescently labeled probes complementary to the target DNA template have quenchers attached that prevent fluorescence emission until the probes are degraded by the 5′ to 3′ exonuclease activity of the polymerase during the PCR amplification reaction. (C) Newer probe designs include fluorescence quenchers attached to the probe. Shown are two examples of such fluorescent dye-quencher probe designs: one as a single probe with step-loop structures to keep the fluorescent dye and quencher together and the other one as a duplex with one strand having the fluorescent dye and the other complementary strand having the quencher. The quenchers are removed during the second amplification cycle, such that the fluorescently labeled probe sequence can then hybridize to the complementary sequence on the newly synthesized target sequence. The blocker prevents the polymerase from extending the PCR primer. The fluorescence detected is directly proportional to the amount of target DNA present in the sample. (D) For qPCR analysis, the fluorescence is plotted versus the number of PCR thermocycles on a logarithmic scale, where the number of cycles at which the fluorescence is detected above the threshold is referred to as the threshold cycle (Ct), which is proportional to the amount of target DNA template in the sample.
For quantification, the qPCR procedure determines the kinetics of the increase in fluorescence intensity after each round of PCR amplification—this is the “real-time” aspect of the method—and relates these kinetics to a parameter called the threshold cycle number (Ct), which is inversely proportional to the starting concentration of the template DNA. Computer software analysis programs are then used to calculate the relative concentrations of each 16S rRNA gene, which is proportional to the relative number of bacteria of each species in the starting microbial community. Relative quantification of target DNA can be determined based on comparison of the Ct obtained with that of an internal reference bacterium. Absolute quantification of a target bacterium in a sample can be determined by comparison of the Ct obtained with DNA standards using a calibration curve generated from titration of serial tenfold dilutions of a known concentration of the target bacterium.
Читать дальшеИнтервал:
Закладка:
Похожие книги на «Bacterial Pathogenesis»
Представляем Вашему вниманию похожие книги на «Bacterial Pathogenesis» списком для выбора. Мы отобрали схожую по названию и смыслу литературу в надежде предоставить читателям больше вариантов отыскать новые, интересные, ещё непрочитанные произведения.


Обсуждение, отзывы о книге «Bacterial Pathogenesis» и просто собственные мнения читателей. Оставьте ваши комментарии, напишите, что Вы думаете о произведении, его смысле или главных героях. Укажите что конкретно понравилось, а что нет, и почему Вы так считаете.